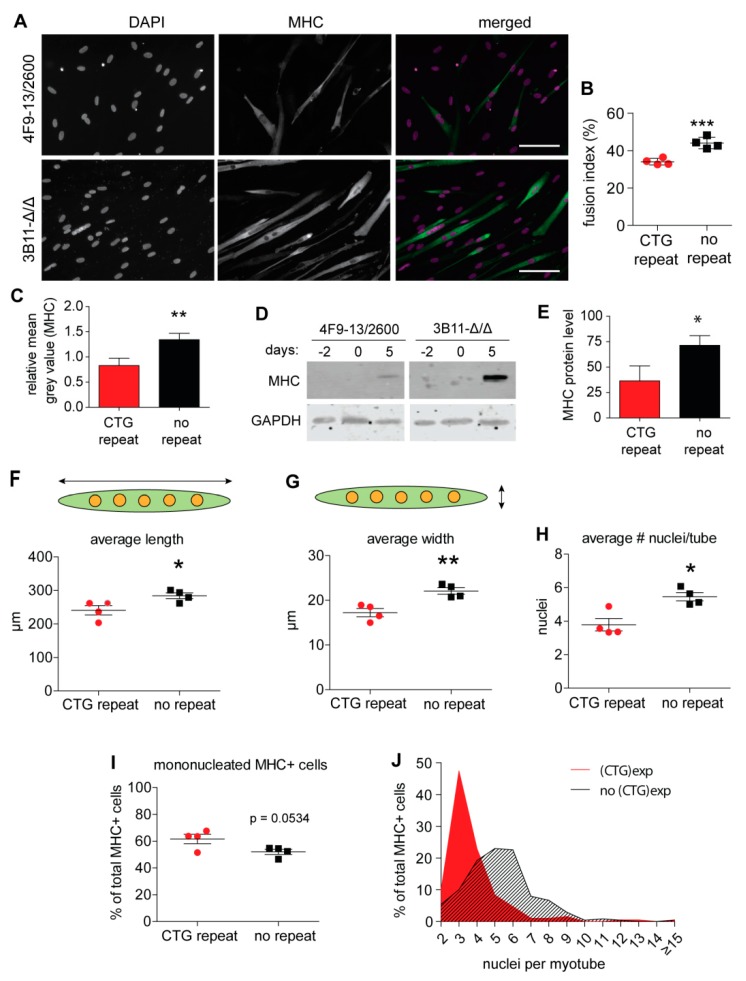
Figure 1.
Myogenic fusion capacity of myoblasts with and without the expanded (CTG)2600 repeat. (A) Images of myotube formation after five days of differentiation in myoblast lineages with (4F9) and without (3B11) the (CTG)2600 repeat expansion. Myosin heavy chain (MHC) staining is shown in green, whilst DAPI is shown in magenta. Bar = 100 µm. (B) Fusion index: Each data point represents the mean of three independent differentiation experiments for one myoblast lineage (mean ± SEM). (C) Group-wise microscopic quantification of the mean grey values of MHC staining in immunofluorescent images of cells with and without a repeat. (D) Western blot visualization of MHC protein levels in proliferating myoblast cultures (day -2), at the start (day 0), and on day 5 of differentiation. (E) Quantification of MHC expression at day 5 by western blot analysis of extracts from two myoblast lineages with and two lineages without the (CTG)2600 repeat. Averaged MHC signal intensities (arbitrary units) determined from three independent differentiation experiments are shown (mean ± SEM). * p < 0.05, ** p < 0.01, *** p < 0.001 (two-way ANOVA). (F–H) Morphotyping of myotubes formed from myoblasts with and without the (CTG)2600 repeat. Myotubes in five-day differentiated cultures were analyzed for their average length (F), width (G), and number of nuclei per tube (H). (I) Quantification of mononucleated MHC-positive cells in the myogenic culture. (J) Histogram depicting the number of nuclei per myotube. Each data point in F–I represents one of the four cell lines with or without the (CTG)2600 repeat expansion, averaged for four independent experiments (mean ± SEM; on average, 56 myotubes were included per cell line per experiment). * p < 0.05, ** p < 0.01 (two-way ANOVA).

