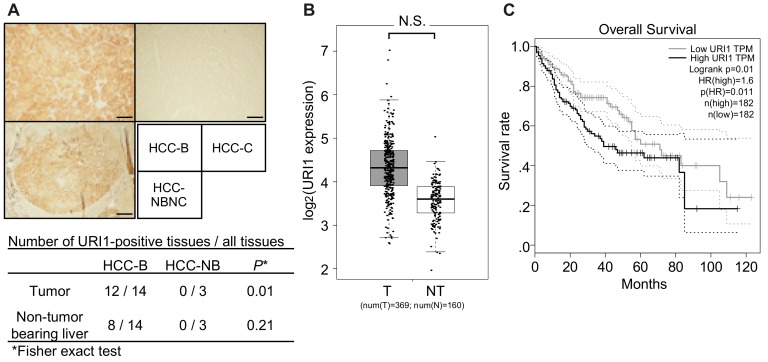
Figure 3.
URI1 expression in HCC-B tumor tissues. (A) Representative images of URI1 immunohistochemistry of URI1-positive HCC-B (upper left), URI1-positive non-HBV-related HCC (lower left), and URI1-negative HCC-C (upper right). Scale bars, 500 µm. Summary of URI1-positive tissues is shown below the images. The p-values were calculated by Fisher’s exact test. (B) URI1 mRNA expression in HCC (T; filled bar) and normal liver (NT; open bar) tissues. N.S., not significant (one-way ANOVA). (C) Kaplan–Meier analysis of the overall survival of patients with high or low URI1 expression levels in HCC tissues. The RNA-seq data were retrieved from the TCGA database.

