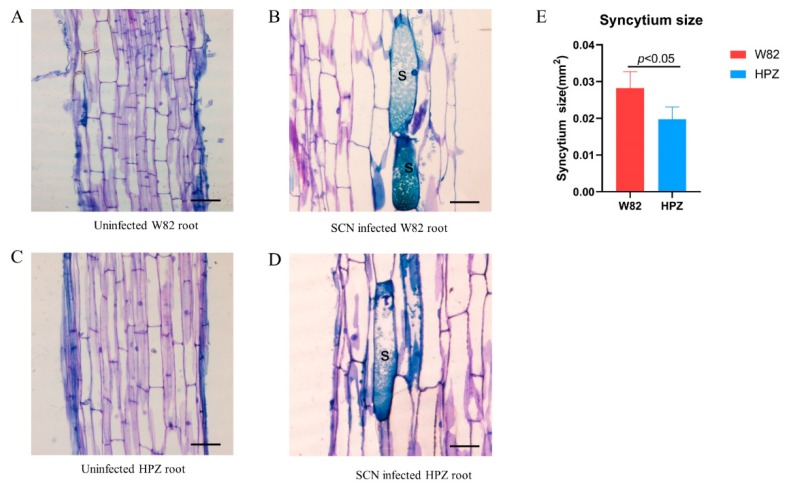
Figure 2.
Histological observation of syncytium size in HPZ and W82 at 5 dpi. (A) uninfected W82 root, bar = 100 μm, (B) SCN-infected W82 root, the syncytium induced by SCN was labeled with “S”, bar = 50 μm, (C) uninfected HPZ root, bar = 100 μm, (D) SCN-infected HPZ root, the syncytium induced by SCN was labeled with “S”, bar = 50 μm, (E) average size of syncytium in W82 and HPZ values are the mean syncytium size, bar, standard error. Pictures of syncytia were taken by an OLYMPUS DP80 light microscope (Olympus, Japan), and the size of the syncytia was measured with Cellsens standard software. Syncytium size data were checked for normality with the Kolmogorov–Smirnov or Shapiro–Wilk test, then the t-test method was used to analyze these above data with SPSS software. Size values of the five syncytia were used for t-test, p < 0.05 means a significant difference was found between W82 and HPZ.

