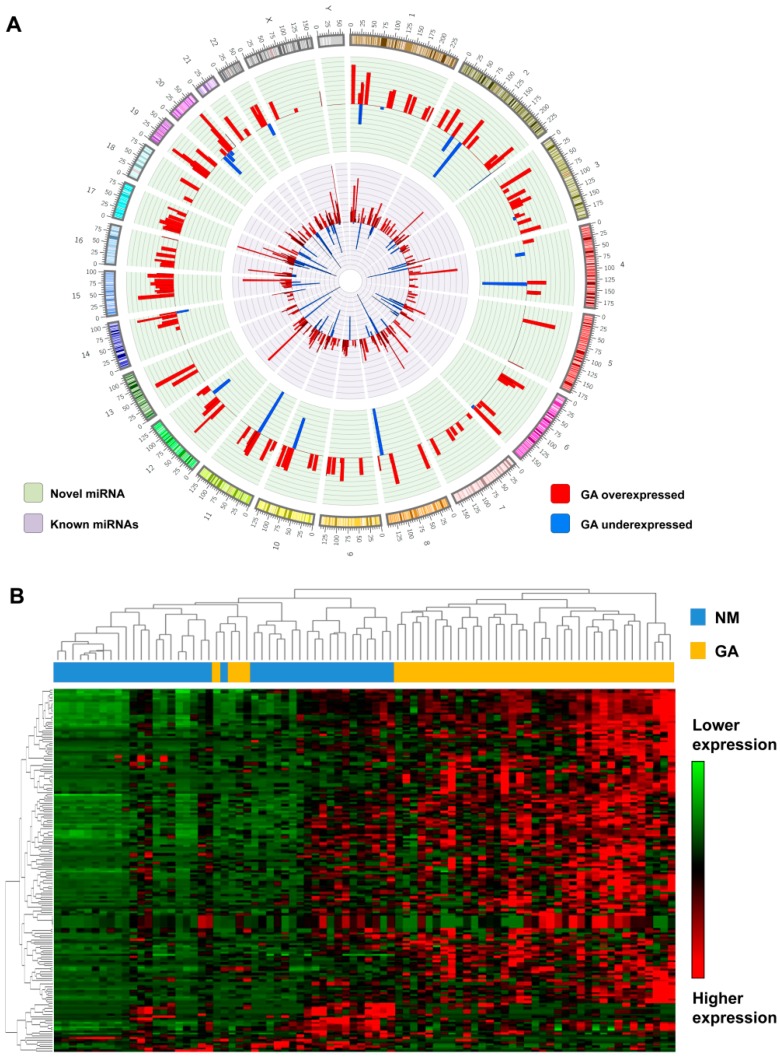
Figure 1.
Updated microRNA (miRNA) expression patterns in gastric adenocarcinoma. (A) Genomic distribution of novel and known miRNAs identified in gastric tissues and their respective expression levels (log2 tumor/nonmalignant ratio). This circular illustration of the genomic localization of the novel and known miRNAs was created using Clico (https://cgdv-upload.persistent.co.in/cgdv/). The histogram represents the fold change values (log2) from the miRNA expression in gastric adenocarcinoma (GA) compared to nonmalignant samples (bar widths of miRNA genomic position were adjusted to 10 MB for illustration). (B) Unsupervised hierarchical clustering analysis of the expression of 170 novel miRNAs shows a clear separation of tumors (yellow) from nonmalignant samples (blue; matched cases from 41 patients).

