Figure 4.
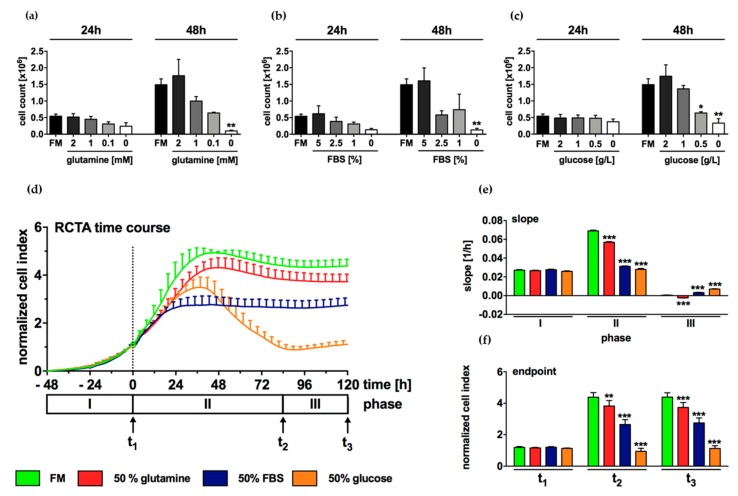
Growth of N-HCC25 cells depends mostly on sufficient levels of glucose and FBS. (a–c) After an adherence phase of 24 h, N-HCC25 cells were cultured with reduced glutamine, FBS or glucose in various concentrations for 24 and 48 h. Subsequently, cells were counted in Neubauer chamber. (d–f) Starvation experiments were repeated in xCELLigence real-time cell analyzer (RTCA) for longitudinal measurement of cell density. 48 h after seeding in full medium (FM), cells were treated with halved amounts of glutamine (2 mM), FBS [5 %] or glucose [2.25 g/L] for 120 h. Data were normalized to the timepoint of stimulation as indicated by the dashed line and grouped into three characteristic phases (I–III). Each phase ends at a respective timepoint t1–3. (e) Slope and (f) endpoint were calculated from the data shown in (d). Cells treated with full medium (FM) containing 4 mM glutamine, 10 % FBS and 4.5 g/L glucose served as control (a–f). Data represent mean ± SEM; n ≥ 3 (starvations of glutamine, FBS & glucose n = 3; FM24h n = 9 and FM48h n = 10) (a–c); or mean ± SD; n (FM) = 4, n (glutamine) = 8, n (FBS) = 6, n (glucose)= 7 (d–f). Statistical significances are indicated as * p < 0.05, ** p < 0.01, *** p < 0.001 vs. FM control in same phase or timepoint. One-way ANOVA (a–c) or two-way ANOVA respectively (d–f) with Bonferroni multiple comparison post-hoc test, GraphPad Prism 7 software, La Jolla, CA, USA).

