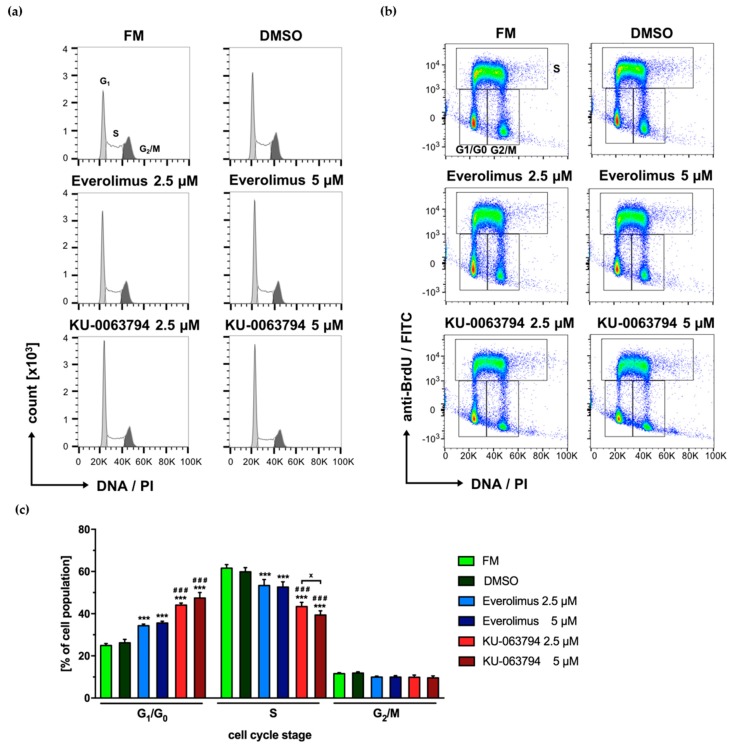
Figure 7.
mTOR pathway inhibition drives N-HCC25 cells into G1/G0 cell cycle arrest. After an adherence phase of 24 h, N-HCC25 cells were treated with Everolimus or KU-0063794 (2.5 µM or 5 µM each) for 24 h and analyzed by flow cytometry for incorporation of BrdU and PI. The applied gating strategy is shown in supplemental Figure S3. Cells cultured in full medium (FM) with or without 0.05% DMSO served as controls. Representative data are shown in the form of histograms (a) and dot plots (b). Statistical analysis of cell cycle distribution obtained from (b) is shown in (c). Graphs represent mean ± SD; n (FM, DMSO) = 3, n (inhibitors) = 5. Statistical significances are indicated as *** p < 0.001 vs. FM and DMSO control in the same cell cycle stage; ### p < 0.001 vs. Everolimus 2.5 µM and 5 µM in same cell cycle stage; x p < 0.05, as indicated. (Two-way ANOVA with Tukey multiple comparison post hoc test, GraphPad Prism 7.0 software, La Jolla, CA, USA).

