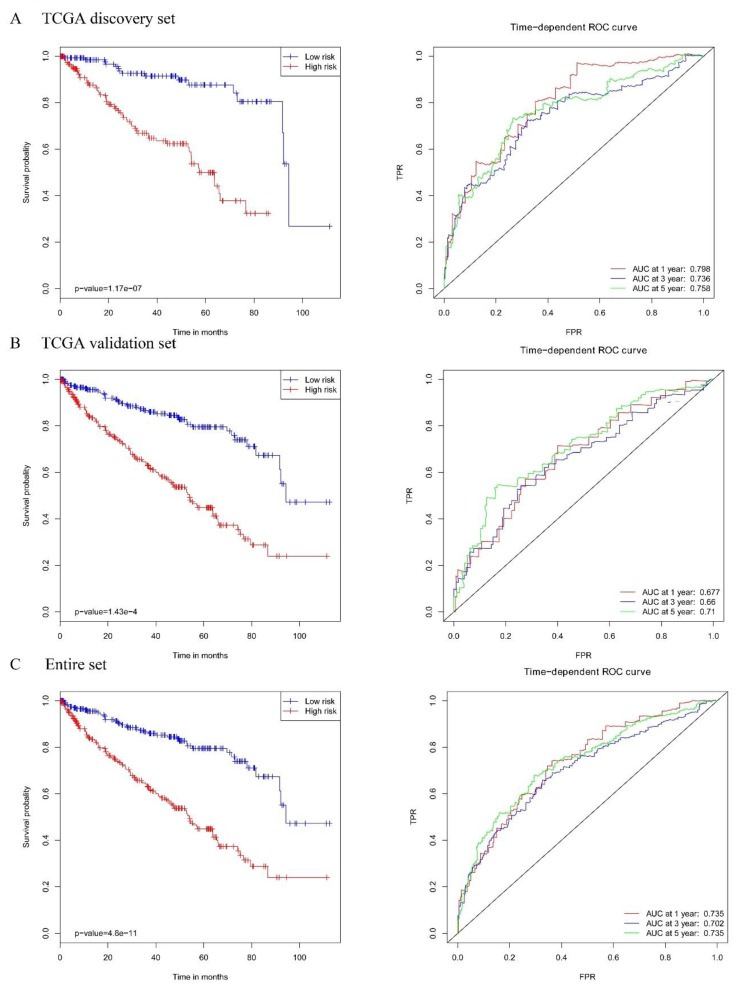
Figure 7.
The Kaplan–Meier plot (low-risk vs. high-risk group) for KIRC patients (left panel); Receiver operating characteristic (ROC) analysis of the sensitivity and specificity of the survival time by a risk score based on the seven-MDEG signature of KIRC (right panel) in (A) the TCGA discovery dataset, (B) the TCGA validation set, and (C) the entire set.

