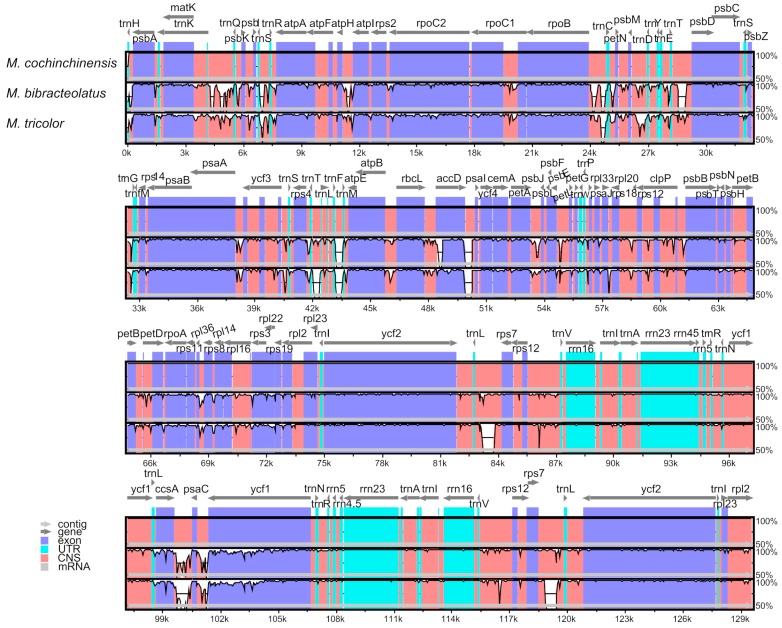
Figure 6.
Sequence identity plot comparing the three chloroplast genomes with M. cochinchinensis as a reference by using mVISTA. Grey arrows and thick black lines above the alignment indicate genes with their orientation and the position of their IRs, respectively. A cut-off of 70% identity was used for the plots, and the Y-scale represents the percent identity ranging from 50% to 100%.

