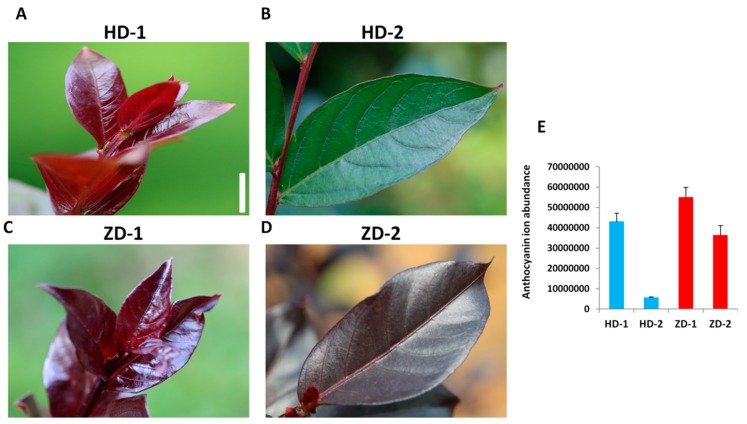
Figure 1.
The phenotypes of young (A,C) and mature (B,D) leaves of HD and ZD. The bar represents 1.2 cm. (E) Total anthocyanin content measured in leaves of HD and ZD at young (Stage 1, S1) and mature (Stage 2, S2) stages. HD represents the cultivar Lagerstroemia Dynamite, while ZD represent the cultivar Lagerstroemia Ebony Embers. Data are from three replicate samples and represent the ion abundance of the anthocyanin compounds.

