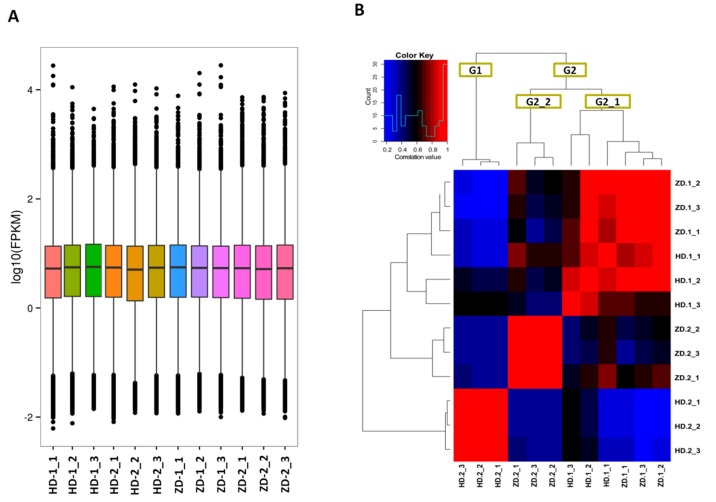
Figure 3.
Overview of the transcriptome sequencing in L. indica leaves. (A) Gene expression profiles in the 12 libraries. HD represents the cultivar Lagerstroemia Dynamite, while ZD represents the cultivar Lagerstroemia Ebony Embers; (B) heatmap clustering showing correlation among samples based on global expression profiles. G1 and G2 represent the two major groups of samples, while G2_1 and G2_2 represent the subgroups of the group G2.

