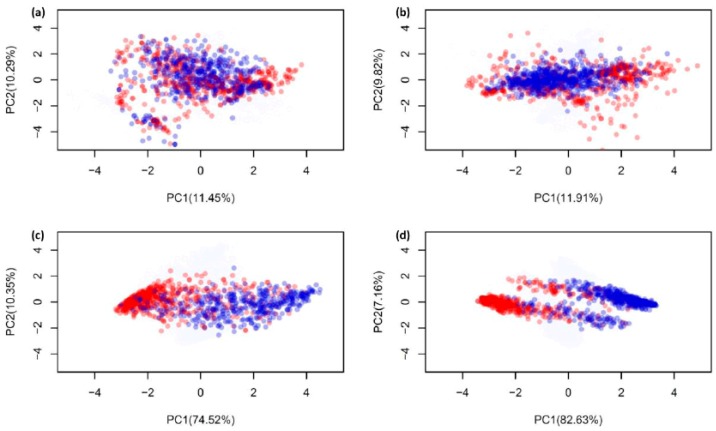
Figure 6.
Principle component analysis (PCA) scores plot of the distribution of AVPs and Non-AVPs, where AVPs and Non-AVPs are represented by red and blue circles, respectively. (a) and (c) represent the distribution of amino acid composition and a new feature representation, respectively, obtained from the dataset T544p+407n + V60p+45n, while (b) and (d) represent the distribution of pseudo amino acid composition and a new feature representation, respectively, obtained from the dataset T544p+544n + V60p+60n.

