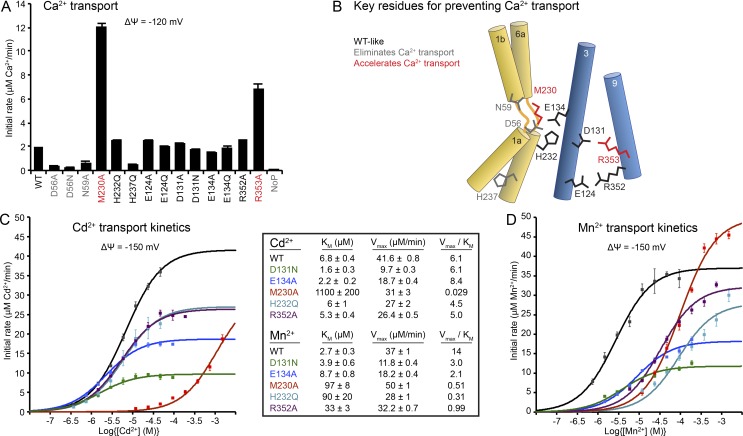
Figure 9.
Perturbations to the conserved salt-bridge network alter metal selectivity and increase Km for Mn2+. (A) Average initial Ca2+ transport rates ± SEM (n ≥ 4) at −120 mV with pH 7.0 on both sides of the membrane and 750 µM Ca2+. (B) Schematic of mutation locations. M230A, or R353A, 15 Å away; both increased Ca2+ transport. D56 and N59 mutations eliminated Ca2+ uptake, and other mutants were similar to WT. (C and D) Dose–response curves of Cd2+ (C) or Mn2+ (D) transport at −150 mV with pH 7.0 on both sides of the membrane for a subset of mutants that reduce or eliminate ΔΨ dependence, ΔpH stimulation, or metal-dependent proton transport. Data are averages ± SEM (n ≥ 2). The resulting transport kinetic values (middle) show significant overlap for Cd2+ transport but wider separation for the physiological substrate Mn2+. M230A is the only mutation that impaired Cd2+ transport more severely than Mn2+ transport. Errors in Km and Vmax encompass the uncertainty of the fit to the data. See also Fig. S10 for representative time traces of the data in A.

