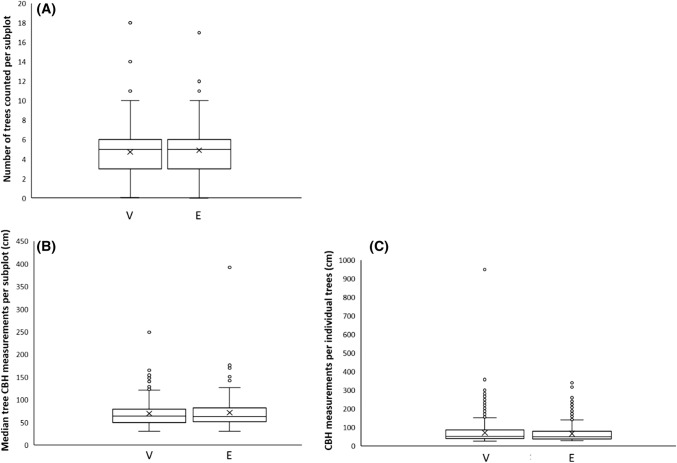
Fig. 2.
Box and whisker diagrams showing distribution of values generated by volunteers and ecologists on Buton Island, Indonesia for a number of trees counted per subplot, b median circumference-at-breast-height (CBH) values aggregated by subplot, c circumference-at-breast-height (CBH) values for individual trees. Box plots underscored by a ‘V’ indicate values generated by volunteers, while box plots underscored by an ‘E’ indicate values generated by ecologists

