Figure 2.
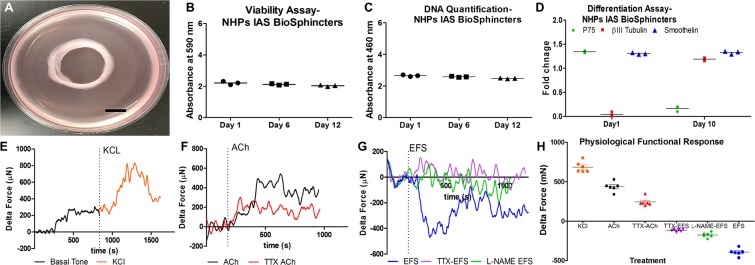
Bioengineering and characterization of IAS BioSphincters: (A) Bioengineered IAS BioSphincter. (B) Viability assay (n = 3); (C) Proliferation Assay (n = 3); (D) mRNA expression of different proteins at day 1 and 10; Physiological functional analysis exhibited; (E) generation of basal tone (black) following rapid contraction response to treatment with 60 mM potassium chloride (orange), which was maintained for 6 min and returned to baseline; (F) Rapid contractile response to 40 µM acetylcholine (black) treatment which partially diminished on pre-treatment of TTX (40 µM) in red; (G) Electrical field stimulation caused relaxation (blue) for 20 min, which was partially improved on pre-treatment of nNOS inhibitor (green) and completely attenuated on pre-treatment of TTX (40 µM); (H) summarized expression of physiological response exhibited by all the BioSphincters (n = 6) prior to implantation. This graph expressed the mean and standard error (n = 6) independent samples per group (p > 0.05); Line graphs show representative tracings to portray the trend of each treatment. Scale bar 5 mm in image A.

