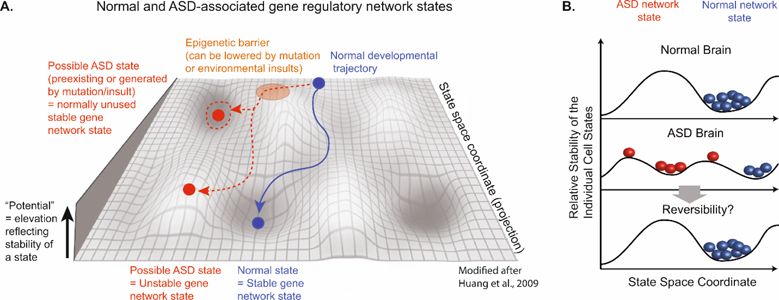
Figure 3. Epigenetic landscape of normal brain development and ASD.

(A) Modified scheme from Huang et al, 2009 [53] of an epigenetic landscape during brain development. The landscape is a schematic projection of a complex gene network into a two-dimensional state space. The y axis represents the relative stability of individual cell states where higher positions indicate less stability. The valleys represent stable attractor states that occupy the low-energy stable basin and are resistant to perturbations. Normal developmental trajectory (blue) progresses from back to front towards a stable attractor state, which represents a distinct neuronal state, and is prevented from entering unused “abnormal attractors” (red dashed circle) along the path due to epigenetic barriers (orange area). Mutations or environmental insults can lower this barrier, thus opening access to unused attractors that encode an abnormal phenotype = ASD attractor state (red dashed arrow). Alternatively, the ASD gene network state may reflect an unstable neuronal state that hinders the formation of stable neuronal networks. (B) Model of ASD network states and their potential reversibility. Scheme shows highly simplified version of proposed model for normal (blue) and ASD (red) gene network states. The y axis represents the relative stability of individual cell states where higher positions indicate less stability. The x axis represents the specific space coordinate of a given neuronal network state. Future potential therapies could be aimed at trying to reverse symptoms of ASD by targeting the ASD network states (red, novel ASD attractor state or unstable state) followed by their conversion into a normal stable neuronal network state (blue).
