Fig. 3.

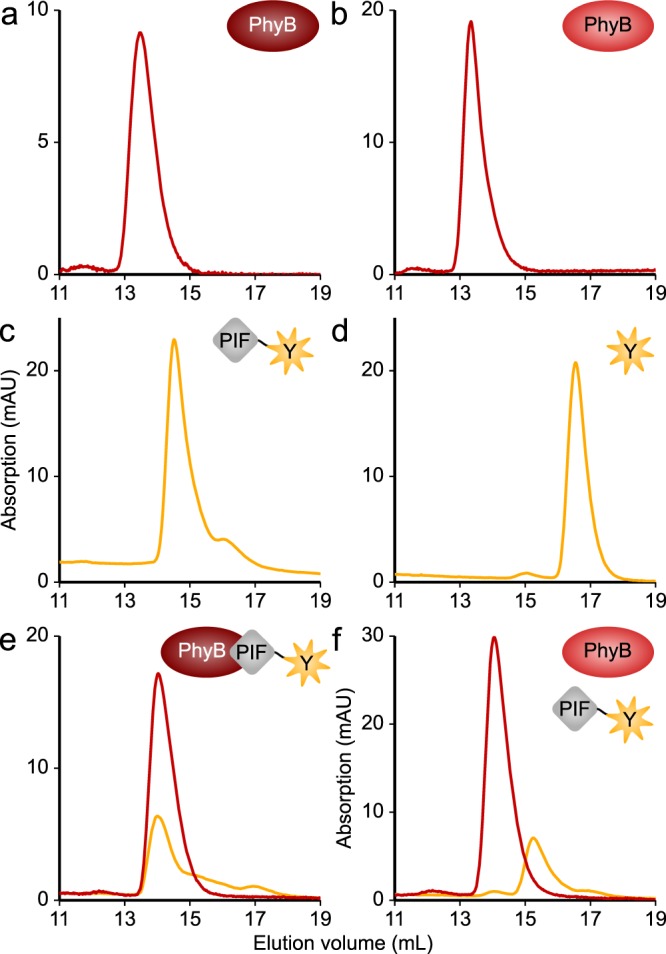
Oligomeric state of the AtPIF variants and light-dependent interactions with the AtPhyB PCM. a 50 µM AtPhyB PCM were exposed to red light and analyzed by size-exclusion chromatography (SEC), where the yellow and red lines represent absorption at 513 and 650 nm, respectively. b As in a but the AtPhyB PCM was exposed to far-red light prior to chromatography. c 10 µM P3.100-EYFP were analyzed by SEC. Elution profiles were independent of illumination. d 10 µM of the negative control EYFP were analyzed by SEC. Elution profiles were independent of light. e A mixture of 10 µM P3.100-EYFP and 50 µM AtPhyB PCM was exposed to red light and analyzed by SEC. f As in e but samples were illuminated with far-red light, rather than red light. Experiments were repeated twice with similar results.
