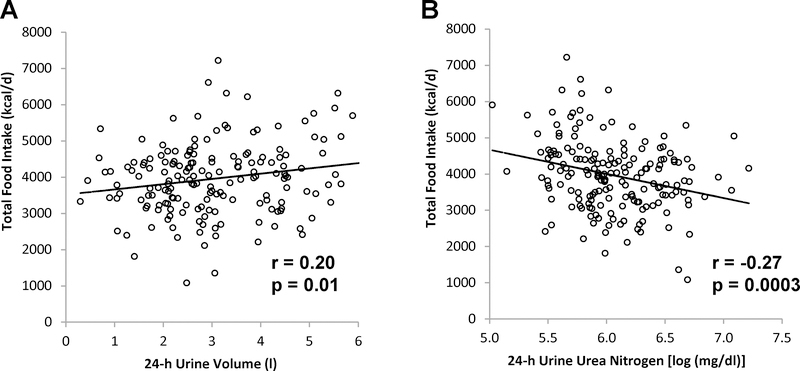
Figure 4.
Relationships between 24-h urine volume and urea nitrogen concentration, and total ad libitum food intake. Energy intake is adjusted age, sex, race, fat mass, fat-free mass, and residual 24-h energy expenditure (A and B). Energy intake also adjusted for 24-h respiratory quotient (B). Pearson’s correlation coefficient (r) is reported along with its significance (p).

