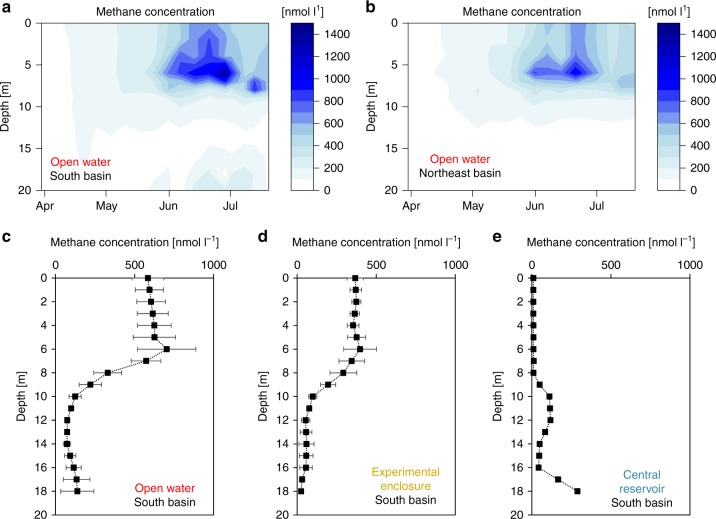
Fig. 2.
Methane accumulation in the water column. Panel a shows the in situ methane concentration [nmol l−1] recorded weekly in 2016 in the South basin (53°08'36.6''N 13°01'42.8''E). Increasing concentration indicates accumulation. Panel b shows the methane concentration [nmol l−1] recorded weekly in 2016 in the Northeast basin (53°09'20.2''N 13°01'51.5''E). Note, panel a contains an additional data point compared to panel b in the end of June. Panel c shows the methane profile in the open lake of the South basin (53°08'36.6''N 13°01'42.8''E; 20.5 m deep) as mean ± SD of 4 profiles taken on 4 different days in August 2014. Panel d shows the methane profile inside experimental enclosure 1 (53°08'36.4''N 13°01'41.6''E; ca. 20 m deep) as mean ± SD of 4 profiles taken on 4 different days in August 2014. Panel e illustrates the methane profile inside the central enclosure (53°08'35.8''N 13°01'41.1''E; ca. 18.5 m deep) as mean ± SD of methodological duplicate measurement taken on 7th July 2016. Source data are provided as a Source Data file.

