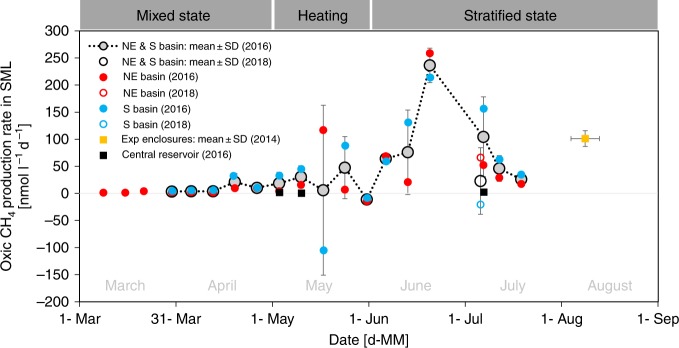
Fig. 3.
Oxic methane production rates. Production rates were computed using a mass balance approach. Red circles represent measurements in the open water of the Northeast basin (69.5 m deep; 53°09'20.2''N 13°01'51.5''E) and blue circles measurements in the open water of the South basin (20.5 m deep; 53°08'36.6''N 13°01'42.8''E). Gray circles are average values of both basins. The yellow square is the average value for the experimental enclosures of the lake lab facility (enclosures 1 and 13), and black squares are measurements in the central reservoir. Vertical error bars illustrate standard deviation from mean values; and horizontal error bars (only experimental enclosures) depict the time frame of corresponding sampling. The mass balance was estimated for unstratified condition in March/April 2016 (negligible lateral methane flux, negligible methane oxidation) and for stratified condition June–August 2014/2016/2018 (lateral methane input from sediments: 1.4 mmol m−2 d−1; 30% of internally produced methane is oxidation). For May 2016, non-stratified parametrization was used for the first half of the month and stratified parametrization for the second half. Methane surface emission was measured in the Northeast basin (except on 20th June 2016) and on 6th July 2018 in the South basin, and was estimated for the other sites based on wind speed parametrization. The sampling schedule for all field measurements is laid out in Supplementary Table 3. Source data are provided as a Source Data file.

