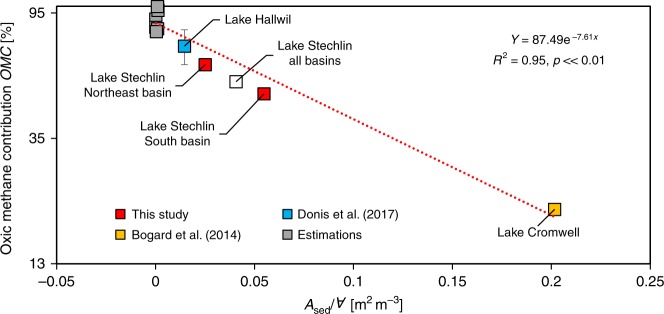
Fig. 4.
Oxic methane contribution versus lake morphology. The ratio of sediment area (Ased) and surface mixed layer volume (∀) determines the oxic methane contribution to surface emission (OMC). The trend line (red line) follows the exponential function (R2 = 0.95, p ≪ 0.01, standard error = 8.6%). The y-axis is scaled to log2.7 and the x-axis is linear. With increasing lake size, ∀ increases quicker than Ased making oxic methane production the largest source of surface mixed layer methane in lakes with Ased/∀ ≤ 0.07 m2 m−3. Lake Hallwil estimation21 was updated as described in Supplementary Note 1; the lower and upper end (error bars) were used to compute the mean OMC which was used for developing the trend line function. Estimations for other lakes were computed as defined in Supplementary Note 3. If whole lake data (combining South and Northeast basin data) was to be applied to this empirical model (empty symbol) the regression constants and statistics only change minimally (; R2 = 0.96, p ≪ 0.01). Source data are provided as a Source Data file.

