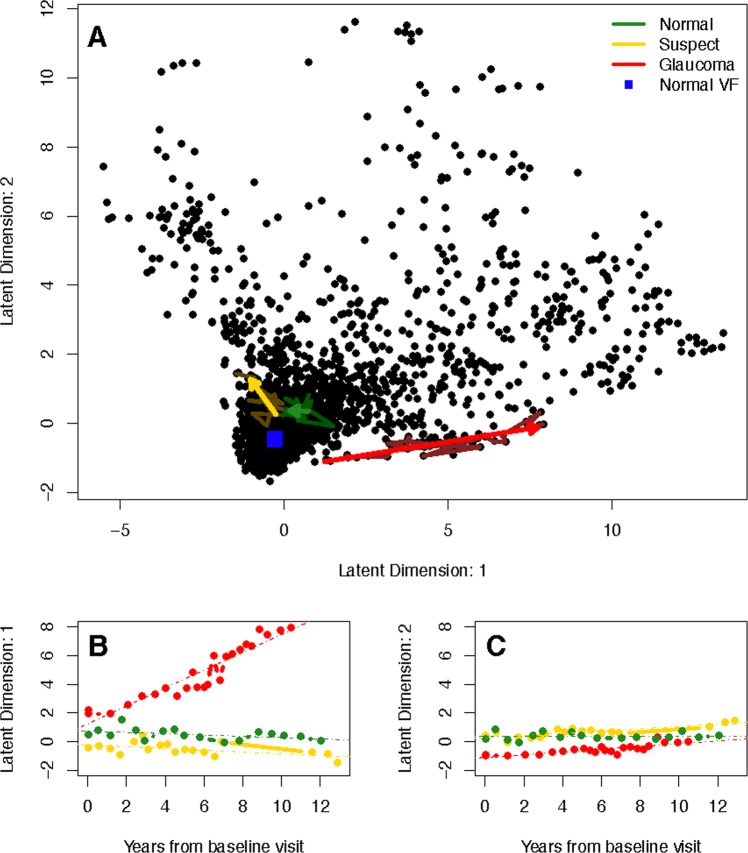
Figure 3.
Visualizing the latent space of the VAE in two dimensions using a linear model. (A) The top frame shows predicted trajectories through the latent space, presented as arrows, are presented for example patients of each disease status. Underlaying the trajectories are the observed longitudinal follow-up for each patient using muted colors. The healthy visual field in latent space is a blue square near the origin. (B) The bottom left frame shows the longitudinal latent features from the first dimension for the example patients. OLS regression lines are presented, which indicate rates of change in each latent dimension. (C) The second dimension is shown in the bottom right.

