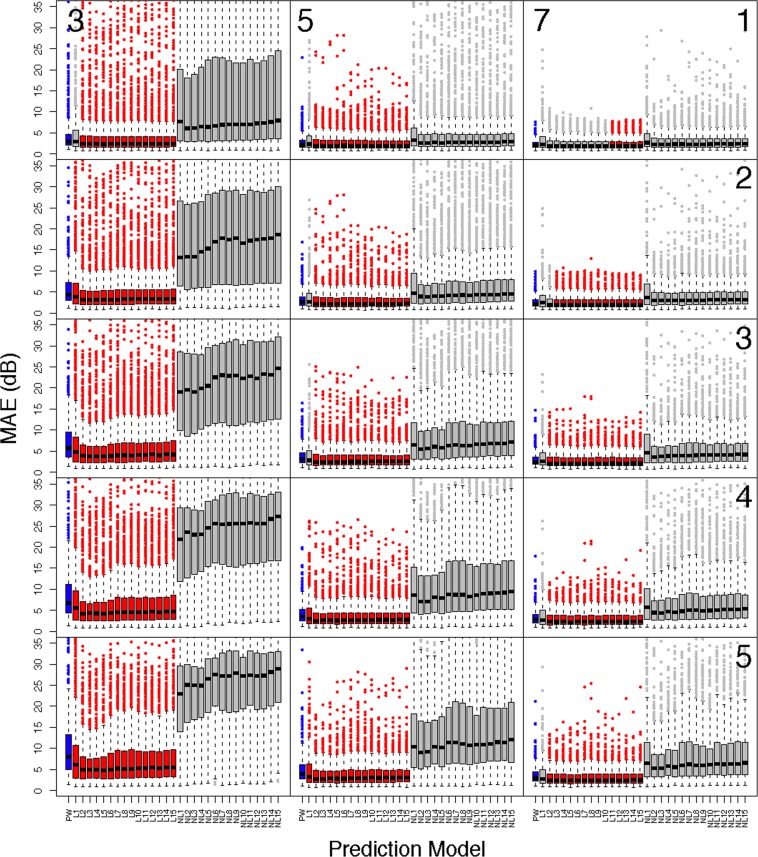
Figure 5.
Comparing the prediction accuracy of the linear and non-linear VAE and PW methods in all patients from the test dataset. Boxplots present summaries of prediction using MAE (dB) over the varying number of latent dimensions. Each column indicates the number of visits used in prediction (3: left, 5: middle, 7:right), and the rows indicate how many visits into the future are predicted (1–5). The PW prediction is given in blue, and any model that is significantly smaller than PW is given in red. Significance is based on a one-sided Wilcoxon signed rank tests, using a Bonferroni corrected type-1 error, 0.05/900 ≈ 0.00006. All predictions are averaged across cross-validation folds.

