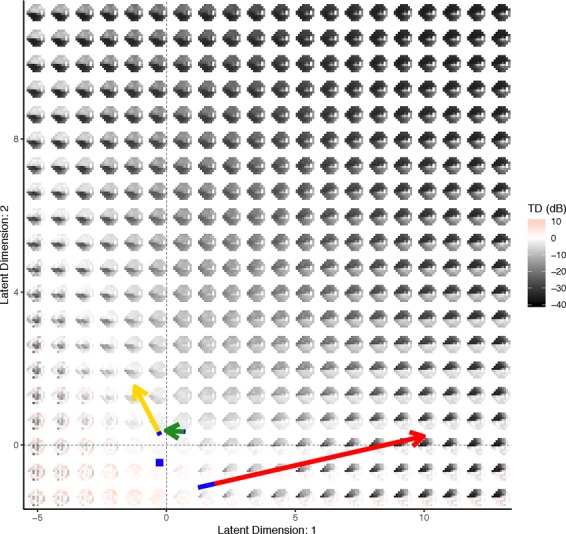
Figure 9.

Visualizing the VAE generative distribution for visual fields with two latent dimensions. Included are the paths of the example patients from Fig. 3. The length of the blue line overlaying each path indicates the speed of change across time and is the length traveled in the first year. The average visual field from all of the normal patients is represented as a blue square. Visualizations are from one cross-validation fold.
