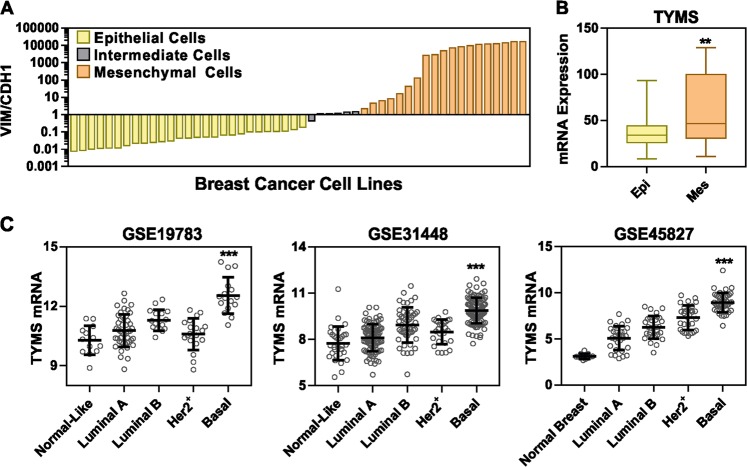
Fig. 1.
TS expression correlates with aggressive form of BC. a Vimentin/E-cadherin (VIM/CDH1) ration in BC cell lines belonging to the CCLE database (gene expression). Cells were sorted in epithelial (n = 27), EMT-intermediate (n = 6) and mesenchymal (n = 19) phenotype. b Comparison of TS mRNA expression levels between epithelial and mesenchymal BC cell lines (p = 0.0039, two-tailed t-test). c TS mRNA levels in BC tissues divided according to molecular subtypes in indicated GEO datasets (p < 0.0001 in all datasets, compared between luminal A and basal subtypes, one-way ANOVA, Turkey’s multiple comparison)

