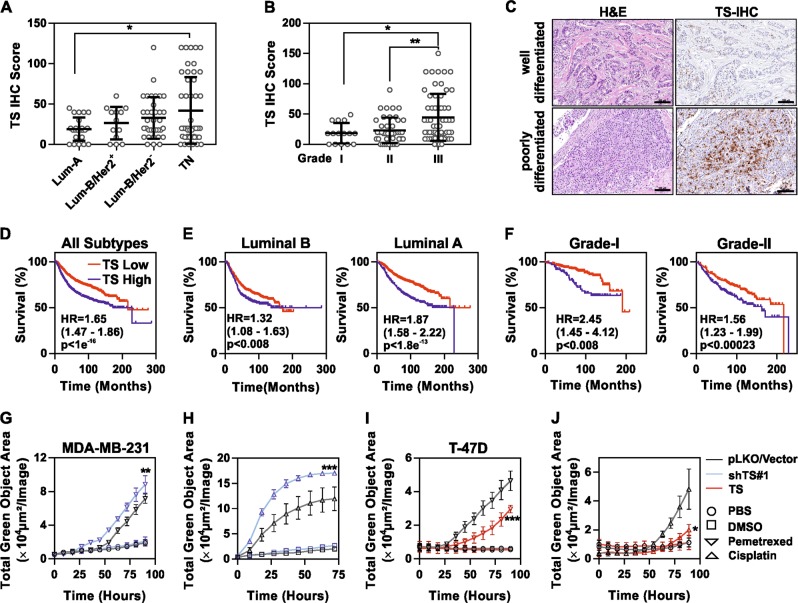
Fig. 2.
TS is a marker of aggressive, chemoresistant and EMT-driven BC. a Immunohistochemical staining of TS in FFPE samples from BC patients (n = 120) segregated according to molecular subtype or b grade of differentiation (p = 0.0237 between luminal A and TNBC and 0.0119 between Grade I and III, one way ANOVA, Turkey’s multiple comparison). Grade III are poorly differentiated cancers. c Representative images showing H&E and TS staining in well-differentiated and poorly-differentiated tumors (scale bars represent 100 µm). Kaplan–Meier curves showing the prognostic significance of TS expression in BC (all types) (d), in luminal (e), and in low grade patients (f). P-values are log-rank tests and HR is hazard ratio. MDA-MB-231 cells with shTS#1 knockdown, treated with (g) 1.5 mM pemetrexed and (h) 500 µM cisplatin (p = 0.0019 for pemetrexed and <0.0001 for cisplatin, between treatment of shTS#1 and pLKO, two way ANOVA, Turkey’s multiple comparison). Death is recorded as green objects that represent the dying cells that incorporate Cytotoxic Green dye. T-47D cells overexpressing TS (TS, red) and empty vector (Vector, black) treated with 1.5 mM pemetrexed (i) and 50 µM cisplatin (j) in presence of Cytotoxic Green dye (p = 0.0009 for pemetrexed and 0.0341 for cisplatin, between treatment of empty vector and TS, two-way ANOVA, Turkey’s multiple comparison). Experimental data are representative of at least two independent experiments with similar results. Points are avg ± SD

