Fig. 3.
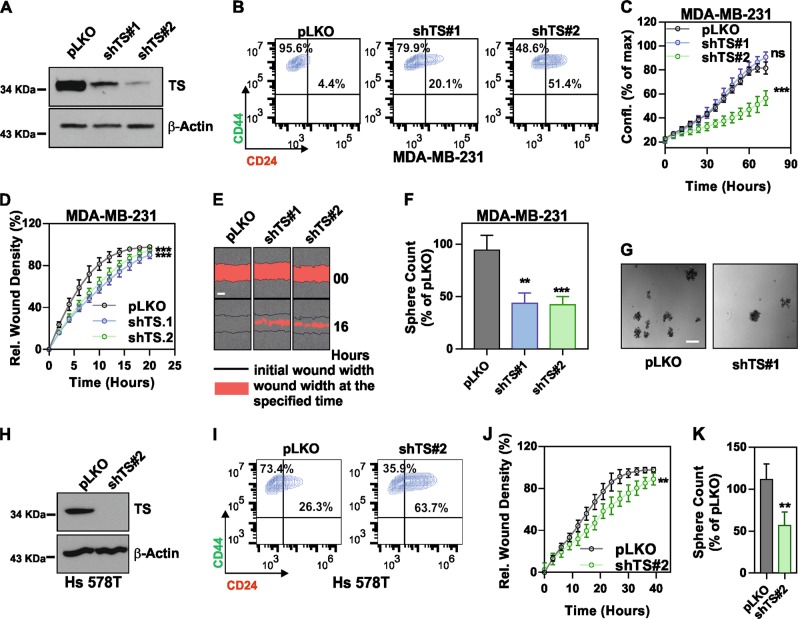
TS knockdown suppresses the mesenchymal phenotype of TNBCs. a Efficiency of TS knockdown in MDA-MB-231 obtained with shRNA lentiviral particles. pLKO is non-targeting control. b FACS plots of MDA-MB-231 cells as in a stained with CD44-FITC and CD24-PE. Gates are based on unstained control cells. c Real-time measurement of growth (confluency) in MDA-MB-231 with shTS or control cell (p = ns for shTS#1 and <0.0001 for shTS#2, as compared to pLKO, two-way ANOVA, Dunett’s multiple comparison). d Real-time migration assay in MDA-MB-231 cells with TS knockdown (p < 0.001 for shTS#1 and shTS#2, as compared to pLKO, two-way ANOVA, Dunett’s multiple comparison) and e representative pictures showing wound width at different time points (scale bar represents 300 µm). f Relative counts of spheres (p = 0.0012 for shTS#1 and 0.0001 for shTS#2 as compared to pLKO, one way ANOVA, Dunett’s multiple comparison) and g representative pictures of spheres formed by TS knockdown cells (scale bar represents 400 µm). h Efficiency of TS knockdown in Hs 578T obtained with shRNA lentiviral particles. i FACS plot of shTS and pLKO cells showing the expression of cell surface CD24/CD44. j Effect of TS knockdown on migration of Hs 578T cells (p = 0.0016, two-way ANOVA, Sidak’s multiple comparison). k Relative counts of spheres in Hs 578T TS knockdown cells as compared to pLKO (p = 0.0011, unpaired Student’s t-test). Experimental data are representative of at least two independent experiments with similar results. Points are avg ± SD

