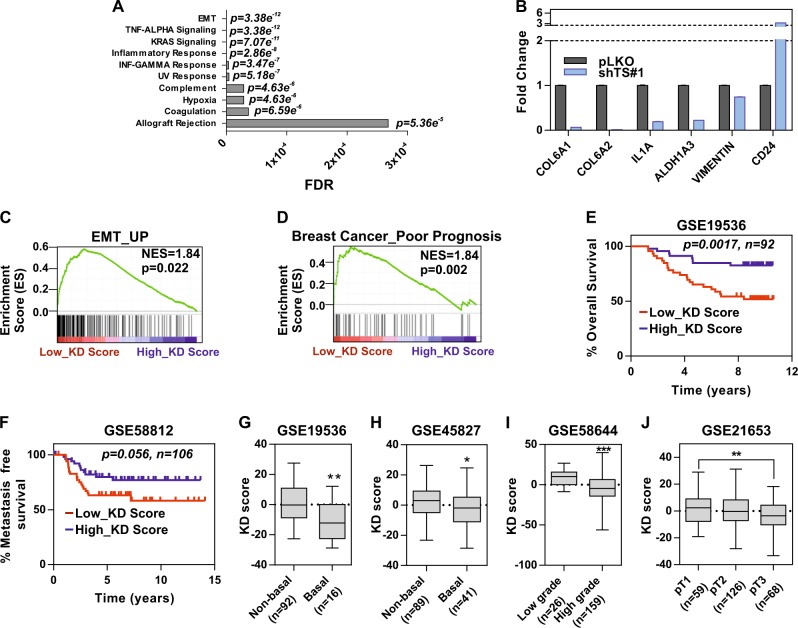
Fig. 5.
TS knockdown suppresses EMT and the associated gene signature correlates with less aggressive BC. a Gene set enrichment (GSEA) analysis showing the most differentially regulated pathways in MDA-MB-231 with TS knockdown (RNAseq data). b qPCR validation of RNA-seq results in MDA-MB-231 shTS#1. Bars are avg ± SEM. GSEA of TS low and high TS KD score (derived from RNA-seq) with previously published (c) EMT and d BC poor prognosis gene signatures, representing NSE (Normalized Enrichment Score) and p-value. Kaplan-Meier curves of e overall survival and f metastasis-free survival in cancer patients stratified by TS KD score. P-values are log-rank tests. TS KD scores in BC patients divided by g–h molecular subtype (p = 0.0022 for GSE19536 and 0.0333 for GSE45827, unpaired two tailed t-test), i grade of differentiation (p < 0.0001, unpaired two tailed t-test), and j TNM tumor size (p = 0.0091, one-way ANOVA, Turkey’s multiple comparison). Experimental data are representative from at least two independent experiments with similar results

