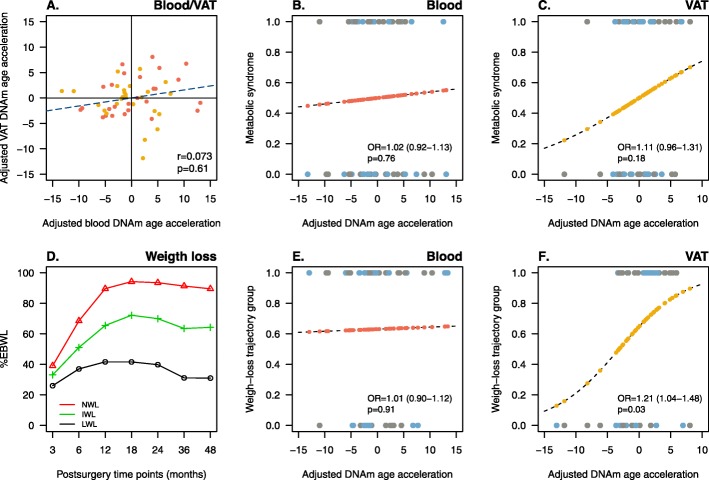
Fig. 3.
The acceleration of epigenetic aging in VAT is associated with a more pronounced weight loss response following bariatric surgery. Panel a shows the correlation between DNA methylation (DNAm) age acceleration adjusted by sex and body mass index (BMI) between blood and visceral adipose tissue—VAT. Red and yellow dots represent participants with and without metabolic syndrome. r and p refer to Pearson correlation coefficients and p values, respectively. Panels b and c show the predicted probability (from 0 to 1), obtained by binomial logistic regression, of each participant to have a healthy (0) or an unhealthy (1) obesity phenotype based on its adjusted DNAm age acceleration in blood (red dots, b) and VAT (yellow dots, c). Panel d shows the three weight-loss clusters resulting from estimating postsurgery excess body weight loss (%EBWL) trajectories for each participant over a follow-up period of 4 years in the traj R package. Red, green, and black lines stand for normal (NWL), intermediate (IWL) and low (LWL) weight-loss trajectory clusters, representing 65%, 30%, and 5% of participants. IWL and LWL clusters were reassigned into a unique group (ILWL). Panels e and f show the predicted probability (from 0 to 1), obtained by binomial logistic regression, of each participant to belongs to the NWL group (1) or to the ILWL group (0), based on its adjusted DNAm age acceleration in blood (red dots, e) and VAT (yellow dots, f). OR is the odds ratio with 95% confidence intervals and p is the p value for the linear trend of association. Blue and gray dots refer to men and women, respectively

