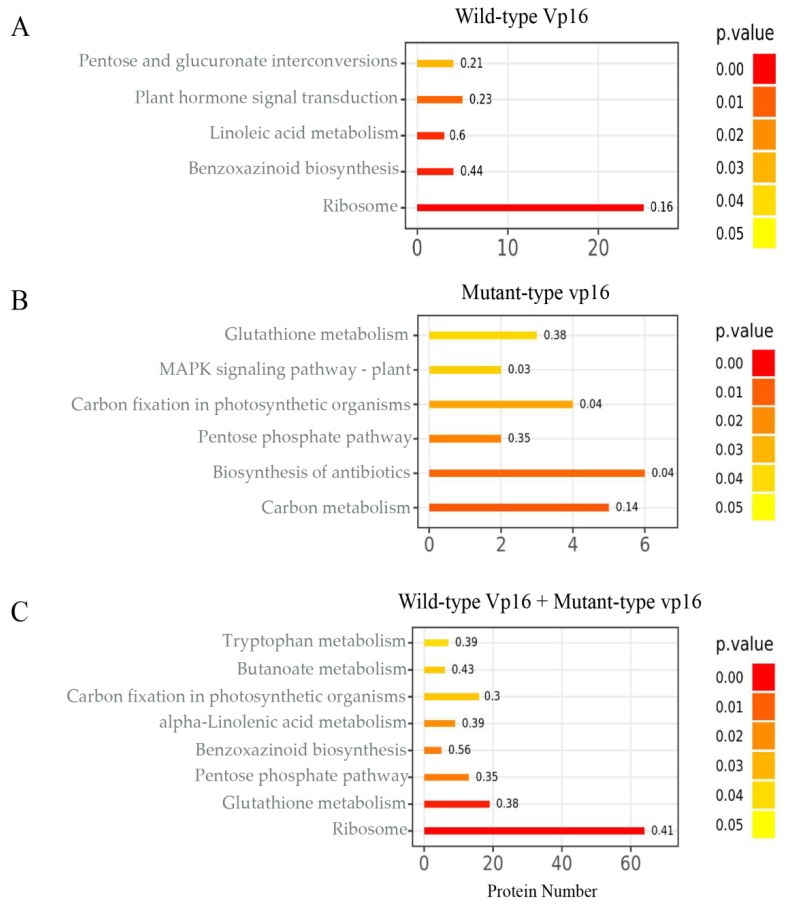
Figure 4.
KEGG pathway enrichment analysis of DAPs. Most significantly enriched pathways under PEG treatment in (A) wild-type Vp16; (B) mutant vp16; and (C) WD_MD comparison. The color gradient (orange to red) corresponds to the level of significance (lower to higher; p-value <0.05; Student’s t-test) of enrichment of the corresponding KEGG pathway. The number on each bar graph indicates enrichment factor (rich factor ≤1).

