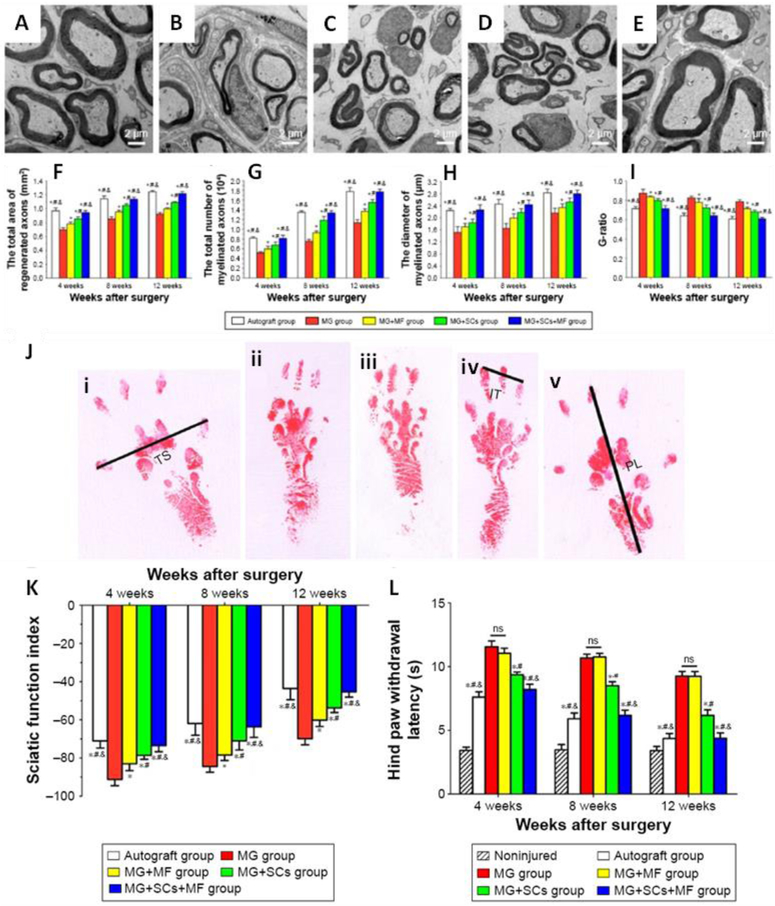
Fig. 5.
Morphologic appearance and morphometric assessments of regenerated nerves in each group. (A-E) The characteristic electron micrographs of regenerated axons in the middle part of the scaffold in the (A) autograft group, (B) MG group, (C) MG+MF group, (D) MG+SCs group, and (E) MG+SCs+MF group at 12 weeks postoperation. (J-K) The sciatic functional index in each group. (F) The cross-sectional area of regenerated nerves in the scaffold. (G) Quantitative analysis of myelinated axons in the scaffold. (H) The diameter of myelinated axons in the scaffold. (I) The G-ratios in the scaffold. (J) The operative left footprints at 12 weeks postoperatively. i) Autograft group. ii) MG group, iii) MG+MF group. iv) MG+SCs group. v) MG+SCs+MF group. (K) The statistical data of the sciatic functional index. (L) The hind paw withdrawal latency time. *p<0.05 compared to MG group; #p<0.05 compared to MG+MF group; &p<0.05 compared to MG+SCs group; all results are presented as the mean ± standard eror of the mean. Abbreviations: MG, the rats were bridged with the magnetic scaffold; MG+MF, the rats were bridged with the magnetic scaffold and under MF exposure after surgery; MG+SCs, the rats were bridged with the Schwann cells-loaded magnetic scaffold; MG+SCs+MF, the rats were bridged with the Schwann cells-loaded magnetic scaffold and under MF after surgery; MF, magnetic field; SCs, Schwann cells. IT, intermediary toe spread; PL, print length; TS, toe spread. Reproduced from Ref. [42] with permission of Dove Medical Press.

