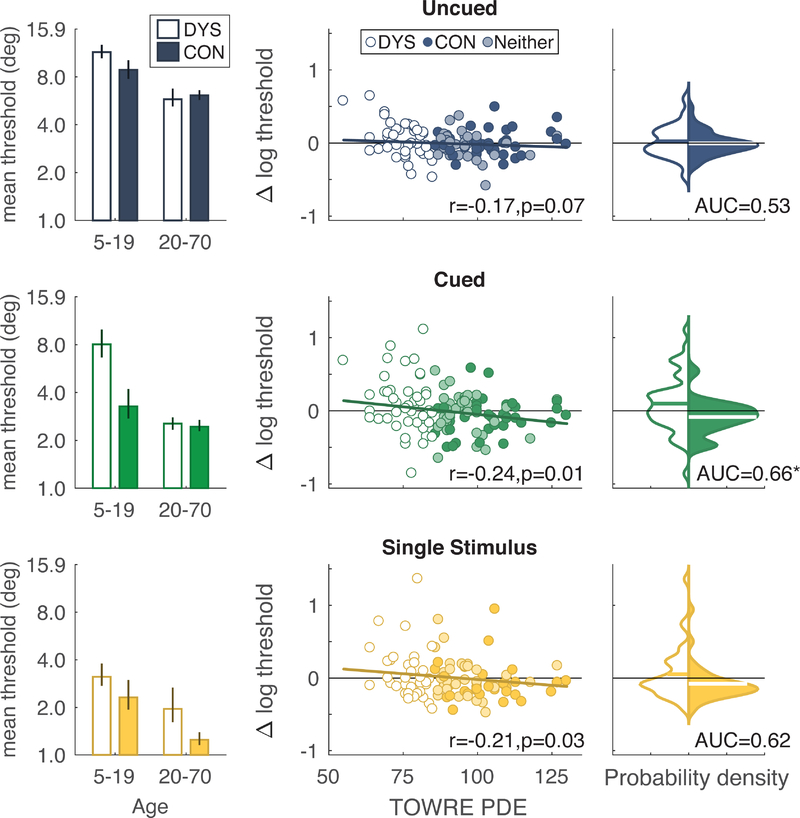
Figure 3.
Threshold differences between good and poor readers. Left column: mean thresholds for subjects divided into two age groups (left pair of bars: 5–19 years; right pair of bars: 20–70 years) and two reading groups (DYS and CON). Error bars are bootstrapped 68% CIs. Middle column: correlations between TOWRE phonemic decoding score (PDE) and the residuals of the developmental model plotted in Figure 2A. This includes all subjects. The y-axis is the difference between each subject’s threshold and the threshold predicted by the developmental model. The solid line is the prediction based on PDE score from a model that also included ADHD and non-verbal IQ as predictors. Right column: smoothed probability density functions of the residuals plotted in the middle column, just for the DYS and CON groups. The Gaussian smoothing kernel bandwidth was set to 0.06. The horizontal line superimposed on each distribution is the mean. The AUC is the area under the ROC curve. The asterisk indicates significant difference from 0.5.

