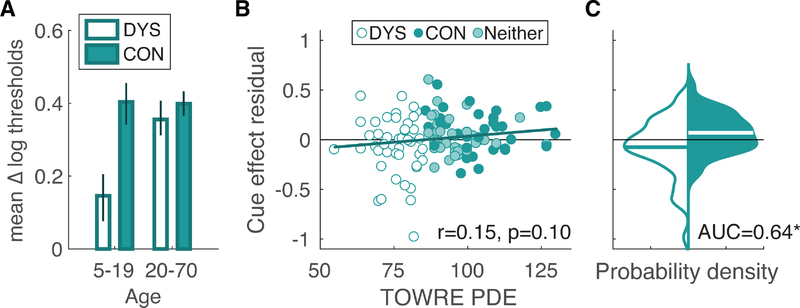
Figure 4.
Relation between the cueing effect on thresholds and reading ability. A: Mean cueing effects, expressed as the difference in log thresholds between the Uncued and Cued conditions. Format as in Figure 3 (left column). B: Correlation between reading score and the residuals from the developmental model of the cueing effect. For each subject, the residual is the difference between their measured cueing effect (Uncued - Cued thresholds) and the prediction of the piecewise linear model of age. The solid line is the prediction based on PDE score from a model that also included ADHD and non-verbal IQ as predictors. C: Smoothed probability density functions of the residuals plotted in the middle column, just for the DYS and CON groups. The horizontal line superimposed on each distribution is the mean. The asterisk indicates that the AUC differs significantly from 0.5.

