Figure 3.
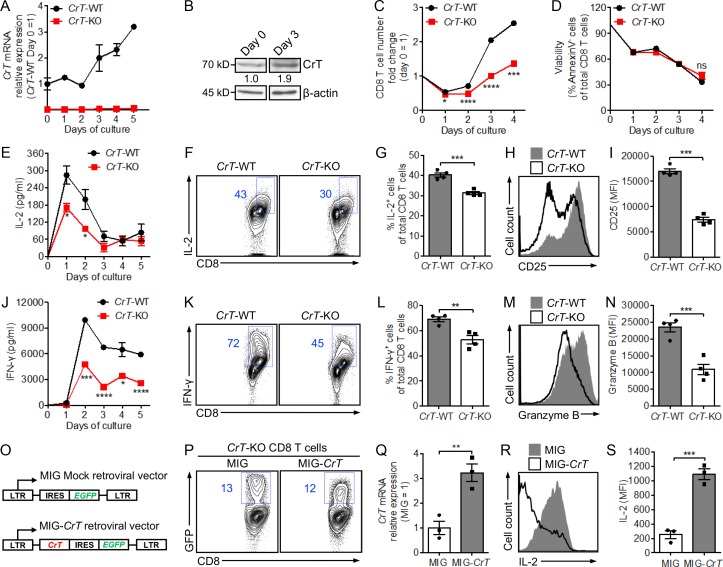
Creatine uptake regulates CD8 T cell response to antigen stimulation. (A–N) CD8 T cells were purified from CrT-WT or CrT-KO mice and stimulated in vitro with plate-bound anti-CD3 (5 µg/ml; n = 3–4). The analyses of CrT mRNA expression (A), CrT protein expression (B), cell proliferation (C), cell survival (D), effector cytokine production (E–G and J–L), activation marker expression (H and I), and cytotoxic molecule production (M and N) are shown, either over a 4- to 5-d time course (A, C, D, E, and J) or 48 h after anti-CD3 stimulation (F–I and K–N). (O–S) CrT-KO CD8 T cells were stimulated in vitro with anti-CD3 and transduced with a MIG-CrT retrovector (O; n = 3). The analyses of retrovector transduction rate (P), CrT mRNA expression (Q), and IL-2 effector cytokine production (R and S) 96 h after stimulation are shown. Representative of two (O–S) and three (A–N) experiments, respectively. Data are presented as the mean ± SEM. ns, not significant; *, P < 0.05; **, P < 0.01; ***, P < 0.001; ****, P < 0.0001 by Student’s t test. See also Fig. S3.

