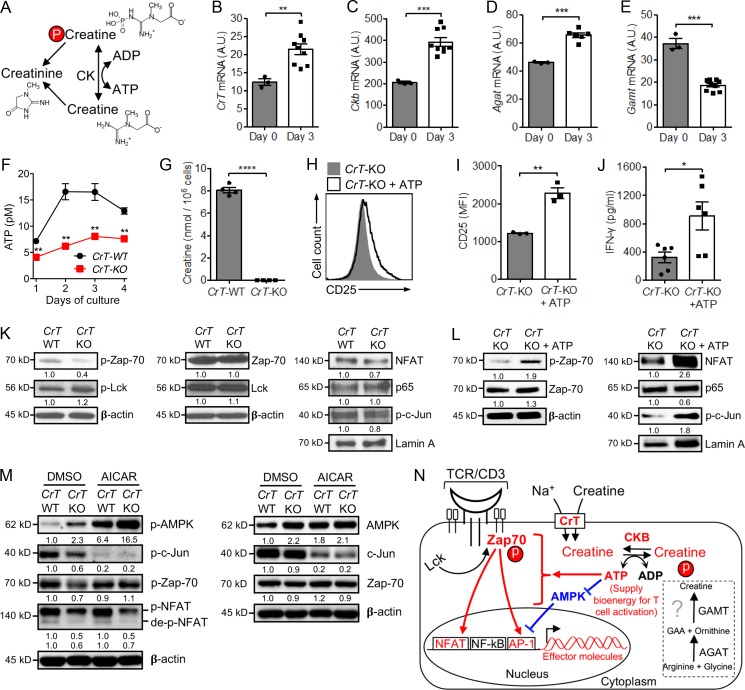
Figure 4.
Creatine uptake modulates CD8 T cell activation by regulating T cell ATP/energy buffering. (A) Schematic of creatine-mediated ATP/energy buffering. (B–E) CrT-WT CD8 T cells were stimulated with anti-CD3 and analyzed for mRNA expression of creatine transporter (CrT; B), Ckb (C), and two enzymes controlling the de novo synthesis of creatine, Agat (D) and Gamt (E). n = 3–9. A.U., artificial unit relative to Ube2d2. (F and G) CrT-WT and CrT-KO CD8 T cells were stimulated with anti-CD3 and analyzed for intracellular levels of ATP over time (F) and creatine at 48 h (G). n = 4. (H–J) CrT-KO CD8 T cells were stimulated with anti-CD3, with or without ATP supplementation (100 µm) in the culture medium, and analyzed for surface CD25 activation marker expression (H and I) and IFN-γ effector cytokine production (J) at day 3. n = 3–6. (K) Western blot analysis of TCR signaling events in CrT-WT and CrT-KO CD8 T cells. CrT-WT and CrT-KO CD8 T cells were stimulated with anti-CD3 for 48 h, rested at 4°C for 2 h, then restimulated with anti-CD3 for 30 min followed by Western blot analysis. (L) Western blot analysis of TCR signaling events in CrT-KO CD8 T cells with or without ATP supplementation. CrT-KO CD8 T cells were stimulated with anti-CD3 for 48 h, rested at 4°C for 2 h, then restimulated with anti-CD3 for 30 min in the presence or absence of ATP supplementation (100 µm) followed by Western blot analysis. (M) Western blot analysis of TCR signaling events in CrT-WT and CrT-KO CD8 T cells with or without AICAR treatment. CrT-WT and CrT-KO CD8 T cells were pretreated with AICAR (2 mM) for 30 min, then stimulated with anti-CD3 for 20 min followed by Western blot analysis. DMSO, solvent used to dissolve AICAR. (N) Schematic model showing creatine uptake regulation of T cell activation signaling events. The demonstrated pathways are highlighted in red and blue. Representative of two experiments (B–M). Data are presented as the mean ± SEM. *, P < 0.05; **, P < 0.01; ***, P < 0.001; ****, P < 0.0001 by Student’s t test. See also Fig. S4.

