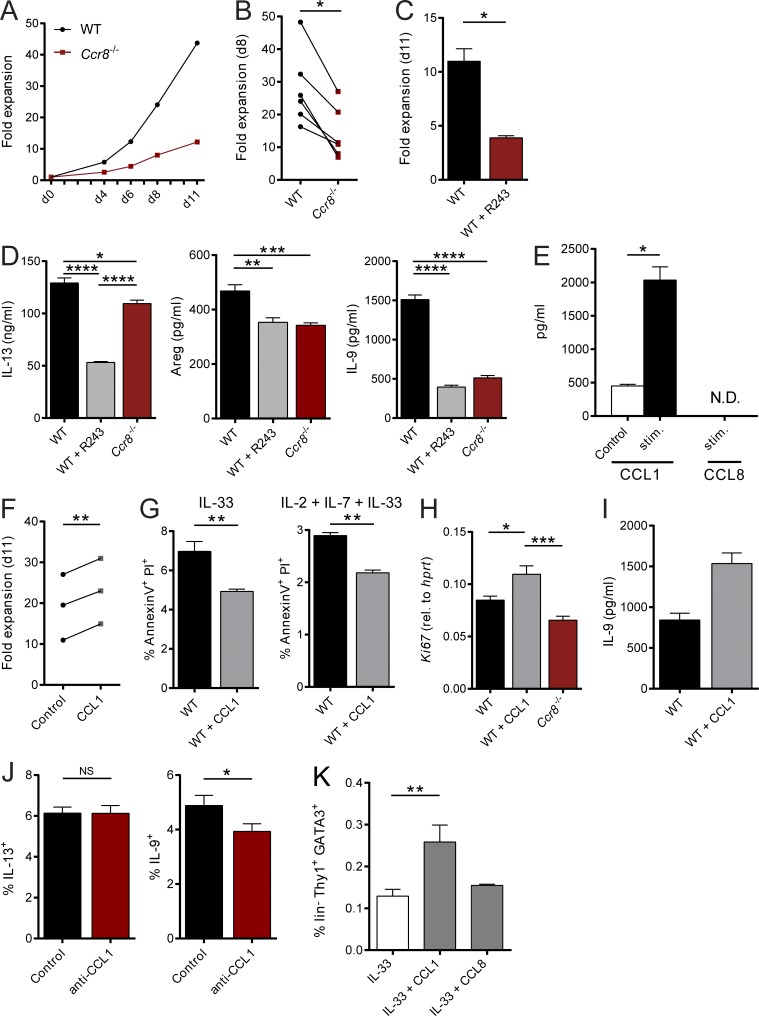
Figure 3.
The CCR8 ligand CCL1 is an autocrine survival factor for ILC2s. (A–C and F) Sorted mouse ILC2s were cultured as described in Materials and methods and cell numbers determined at the indicated days to calculate fold expansion. (A and B) WT and Ccr8−/− ILC2 numbers were compared at indicated time points. (A) One representative experiment is shown. (B) Each replicate represents one independent sorting experiment. An unpaired t test was applied. (C) WT ILC2s were expanded in the presence of the CCR8 inhibitor R243. (D) In vitro–expanded WT ILC2s, WT ILC2s plus R243, and Ccr8−/− ILC2s were restimulated with IL-2, IL-7, and IL-33 (20 ng/ml each). Production of IL-13, Amphiregulin, and IL-9 was measured in the supernatants after 24 h. A one-way ANOVA was applied. (E) To measure secretion of CCL1 and CCL8 by in vitro–expanded murine WT ILC2s, cells were stimulated (IL-2, IL-7, and IL-33; 20 ng/ml each) under addition of PMA/ionomycin, and supernatants were collected after 24 h. (F) WT ILC2s were expanded in the presence of CCL1 (50 ng/ml). Each replicate represents one independent sorting experiment, and a paired t test was applied. (G) To measure cell death, WT ILC2s expanded with or without CCL1 were restimulated for 24 h with IL-33 or IL-2, IL-7, and IL-33 (20 ng/ml each), and Annexin V/PI stainings were performed. (H) WT ILC2s expanded with or without CCL1 or Ccr8−/− ILC2s were restimulated for 24 h with IL-2, IL-7, and IL-33 (20 ng/ml each) and Ki67 expression determined by qPCR. A one-way ANOVA was applied. (I) IL-9 was measured in the supernatant of WT ILC2s expanded with or without CCL1 for 11 d. P = 0.0571. (J) Flow cytometry of WT ILC2s restimulated with IL-2, IL-7, and IL-33 (20 ng/ml each) and a neutralizing anti-CCL1 antibody (10 µg/ml) for 24 h. Monensin was added to the culture for the last 4 h of stimulation. (K) WT mice were challenged with DNA vectors for IL-33, CCL1, or CCL8 as indicated. After 5 d, liver single-cell suspensions were generated and analyzed by flow cytometry. The graphs show pooled data of two independent experiments with at least four mice per group. A one-way ANOVA was applied. (C–E and G–J) Data represent technical replicates of one out of at least two independent experiments. Data represent mean ± SEM. *, P ≤ 0.05; **, P ≤ 0.01; ***, P ≤ 0.001; ****, P ≤ 0.0001 by Mann-Whitney U tests or, if indicated, paired t test, unpaired t test, or one-way ANOVA. N.D., not detected.

