Figure 4.
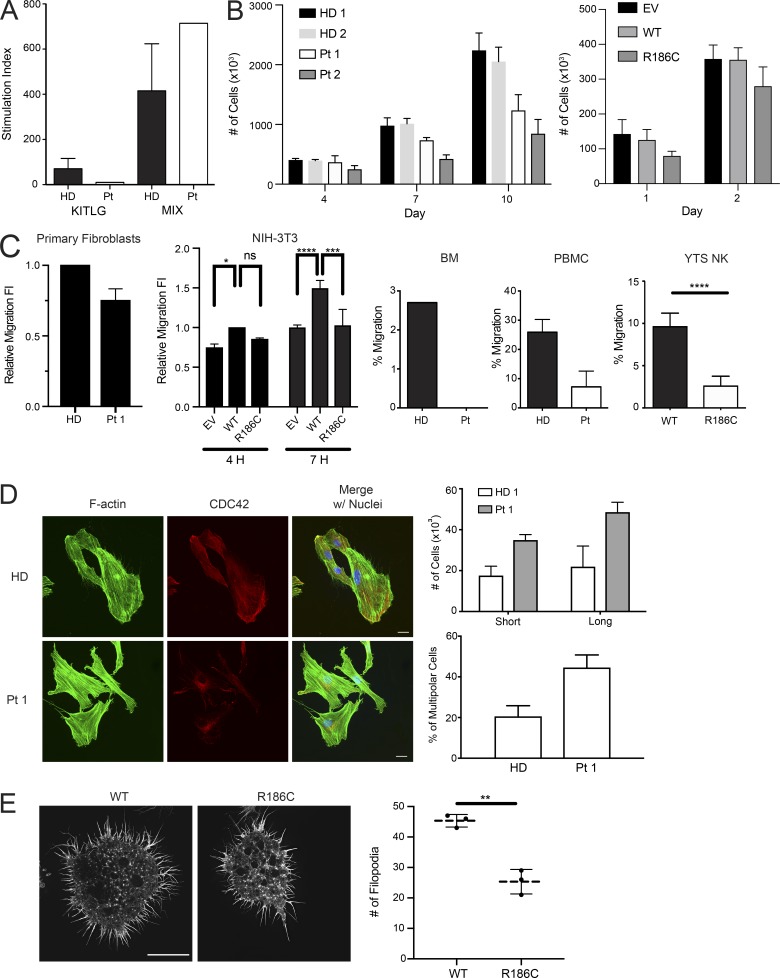
p.R186C is associated with defects in proliferation, migration, and formation of actin-based structures. (A) Proliferation of BM CD34+ cells from Pt 1 in response to stem cell factor (SCF/KITLG) or a cytokine mixture (MIX; n = 1). (B) Proliferation of primary fibroblasts from Pt 1 (n = 3) and Pt 2 (n = 3) at indicated time points of culture, and NIH-3T3 cells transiently expressing WT or mutant CDC42 or an empty vector (EV). (C) Migration assays of primary fibroblasts from Pt 1 (n = 3), transfected NIH-3T3 cells (n = 3; *, P < 0.05; **, P < 0.01; ****, P < 0.0001, two-way ANOVA with Sidak’s multiple comparisons), purified BM CD34+ sorted cells (n = 1), PBMCs (n = 2), and a YTS CRISPR/Cas9-modified cell line (n = 3; ****, P < 0.0001, unpaired two-tailed t test; mean ± SEM for CD34+/PBMCs and mean ± SD for NK cells, NIH-3T3 cell line, and primary fibroblasts). Migration was assayed using a wound-healing assay on primary fibroblasts and transfected NIH-3T3 cells and directed migration toward chemoattractant CXCL12 in BM CD34+ cells, PBMCs, and YTS NK cells. Decreased directed migration of all tested cell types was observed. FI, fold increase of migratory cells. (D) Cytoskeletal rearrangements of cells expressing CDC42R186C. Multipolarization and filopodia in primary fibroblasts from Pt 1 (n = 3) compared with fibroblasts from an HD. Immunofluorescence staining of CDC42 (red), F-actin (green), and nuclei (blue) in cells stimulated 3 h with 20% serum. In HD fibroblasts, CDC42 localizes to the front leading edge, whereas in Pt 1 fibroblasts, the protein mostly localizes to the perinuclear area. On the right of the panel, quantification of multipolar cells and number of cells with short and long filopodia length are shown. Cells bearing multiple F-actin flat protruding edges (butterfly shaped) were considered multipolar. While HD fibroblasts polarize showing a front (leading edge), a large proportion of Pt 1 fibroblasts show multiple protruding edges. Filopodia twofold longer than nuclei diameter were considered long filopodia. Filopodial length and number were notably increased in fibroblasts, suggesting a disruption of CDC42-dependent actin architecture. Scale bar, 20 µm (applicable to all images shown). (E) Filopodia dynamics of the YTS cells on an activating CD18/CD28 surface. Filopodia were imaged using SIM-TIRF microscopy with representative images showing decreased filopodia count (mean ± SD, n = 3; **, P < 0.01, unpaired two-tailed t test with Welch’s correction) in cells expressing CDC42R186C. Scale bar, 10 µm (applicable to all images shown). n.s., not significant.

