Figure 1.
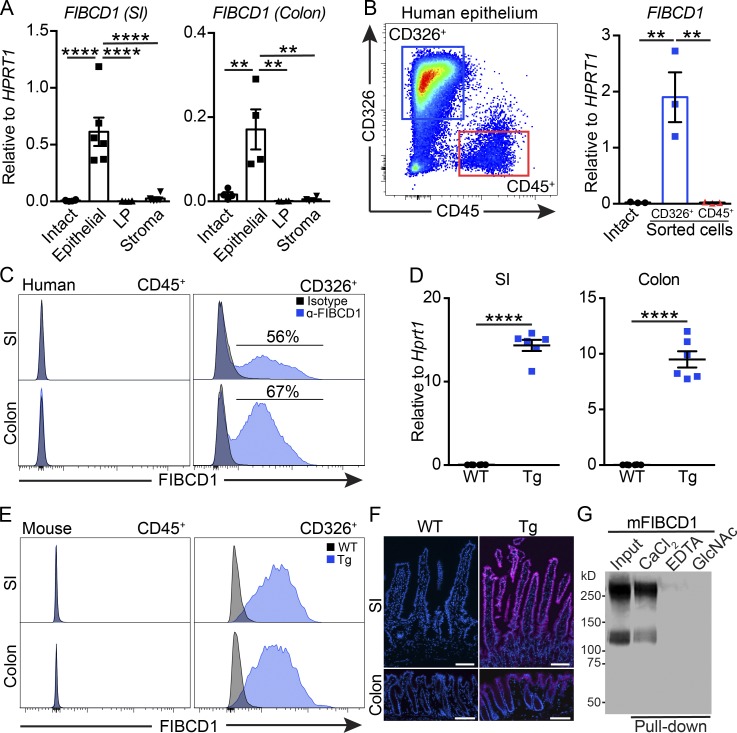
FIBCD1 is expressed on the surface of human IECs, and this can be recapitulated in novel transgenic mice. (A) Analysis of FIBCD1 expression in fractionated SI and colon from healthy human donors (n = 4–6 samples per group). (B) Gating strategy and analysis of FIBCD1 expression in CD45+CD326− hematopoietic cells and CD45−CD326+ epithelial cells sorted from human colon (n = 3 samples per group). (C) Representative histograms of FIBCD1 expression in CD45+CD326− hematopoietic cells and CD45−CD326+ epithelial cells from human SI and colon. (D) Expression of Fibcd1 in SI and colon mouse tissues from WT and Fibcd1Tg (Tg) littermates (n = 6 samples per group). (E) Representative histograms depicting FIBCD1 expression in CD45+CD326− hematopoietic cells and CD45−CD326+ epithelial cells from SI and colon of WT and Tg littermates. (F) Representative immunofluorescence staining for FIBCD1 in SI and colon from WT and Tg littermates. Blue, DAPI; magenta, FIBCD1. Scale bars, 100 µm. (G) Representative pull-down experiment showing acetyl-group-specific and Ca2+-dependent binding of soluble recombinant mFIBCD1 ectodomain to chitin. Results in A and B are pooled data based on three to six independently collected samples from healthy human donors. Data in C–G are representative of at least three independently performed experiments with similar results. Statistics: Data are presented as mean ± SEM where dots represent individual mice. One-way ANOVA followed by Tukey post hoc test was used to analyze results in A and B, and unpaired Student’s t test was used to analyze data in D. **, P < 0.01 and ****, P < 0.0001.

