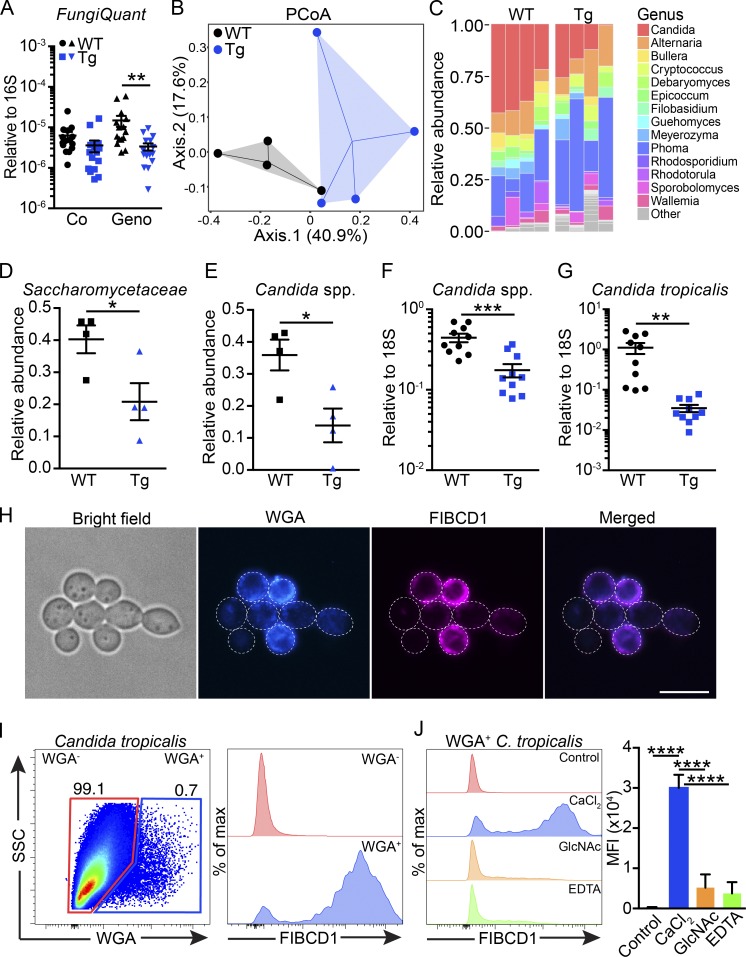
Figure 2.
Expression of FIBCD1 by IECs modulates the intestinal mycobiome and FIBCD1 binds chitin-containing fungi. (A) Assessment of fungal burden (FungiQuant) relative to 16S in WT and Fibcd1Tg (Tg) littermates cohoused (Co) or housed for additional 2 wk based on genotype (Geno; n = 15 samples per group). (B) PCoA ordination based on Bray–Curtis dissimilarities in colonic fungal OTUs (n = 4 samples per group). (C) Fungal composition of the 14 major genera in WT and Tg littermates (n = 4 samples per group). (D and E) Relative abundance of Saccharomycetaceae (family) and the abundant Candida (genus) in WT and Tg littermates quantified by ITS-1 sequencing (n = 4 samples per group). (F and G) Relative abundance of Candida spp. and C. tropicalis normalized to FungiQuant in WT and Tg littermates quantified by qPCR (n = 10 samples per group). (H) Representative fluorescence imaging of recombinant FIBCD1FReD binding a proportion of live C. tropicalis. Blue, WGA; magenta, FIBCD1FReD. Scale bar, 10 µm. (I) Representative scatter plot and histogram of WGA+ C. tropicalis binding recombinant FIBCD1FReD. (J) Histograms and quantification of mean fluorescence intensity (MFI) demonstrating Ca2+-dependent and GlcNAc-specific binding of FIBCD1 to WGA+ C. tropicalis (n = 3 samples per group). Results shown in A–G are representative of two independently performed experiments with similar results. Data shown in H–J are representative of at least three independently performed experiments with similar results. Statistics: Data are presented as mean ± SEM where dots represent individual mice. Two-way ANOVA followed by Holm–Sidak post hoc test was used to analyze results in A, unpaired Student’s t test was used to analyze data in D–G, and one-way ANOVA followed by Tukey post hoc test was used to analyze results in J. *, P < 0.05, **, P < 0.01, ***, P < 0.001, and ****, P < 0.0001. Max, maximum; SSC, side scatter.

