Figure 2.
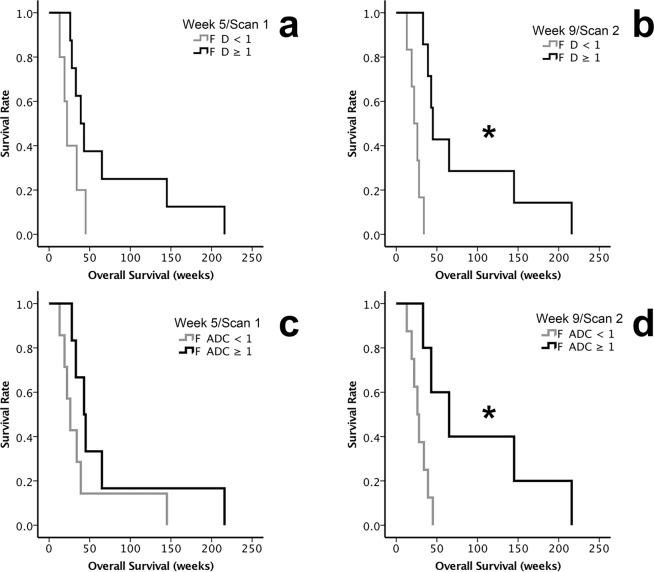
Overall survival (OS) of patients with metastatic melanoma treated with AdCD40L gene therapy assessed by fold change (F) F ADC, F D and F SUVmax of the injected metastases. The analyses were conducted excluding the patients who did not undergo all examinations (n = 13). The Kaplan-Meier method was used followed by log-rank tests. (a) The median OS of patients with F D ≥ 1 (black lines) compared with those with F D < 1 (grey lines) observed in Scan 1 at week 5 (p = 0.075).(b) The median OS of the patients with F D ≥ 1 (black line) compared with the median OS of the patients with F D < 1 (grey line) in Scan 2 at week 9 (p = 0.001).(c) Comparison of the median OS in patients with F ADC ≥ 1 (black lines) and those with F ADC < 1 (grey lines) in Scan 1 at week 5 (p = 0.15).(d) Comparison of the median OS of the patients with F ADC ≥ 1 (black line) to the median OS of the patients with F ADC < 1 (grey line) in Scan 2 at week 9 (p = 0.014). (* indicates p < 0.05).

