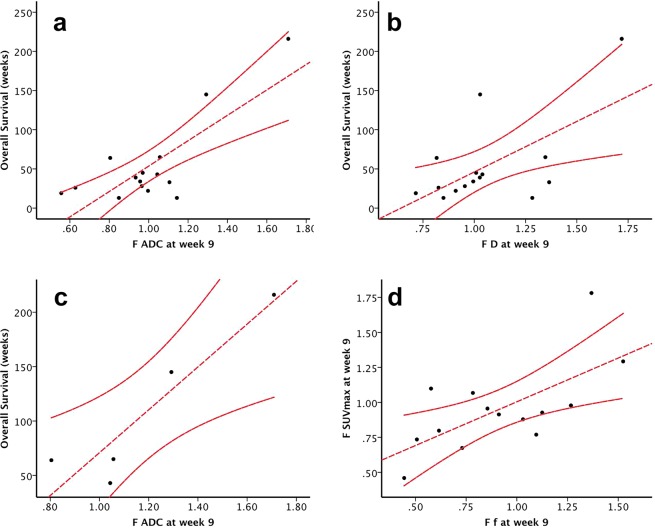
Figure 3.
Correlation analysis of overall survival (OS) with D, and subsequently ADC, in the injected metastases. The Pearson’s correlation analysis was used. (a) F D correlation with OS at week 9 (Scan 2) including all patients (n = 21, p = 0.015, R2 = 0.378). (b) F ADC correlation with OS at week 9 (Scan 2), including all patients (n = 21, p < 0.01, R2 = 0.628). (c) Correlating OS in the group of patients that were “responders” in our previous publications36,51 based on PET/CT evaluations (n = 6) with fold change (F) F ADC in Scan 2 at week 9 (p = 0.023, R2 = 0.861). (d) F f values in the injected metastases were correlated to F SUVmax values at week 9 (Scan 2), including all evaluable patients (n = 21, p = 0.01, R2 = 0.442). The Pearson’s correlation analysis was used.

