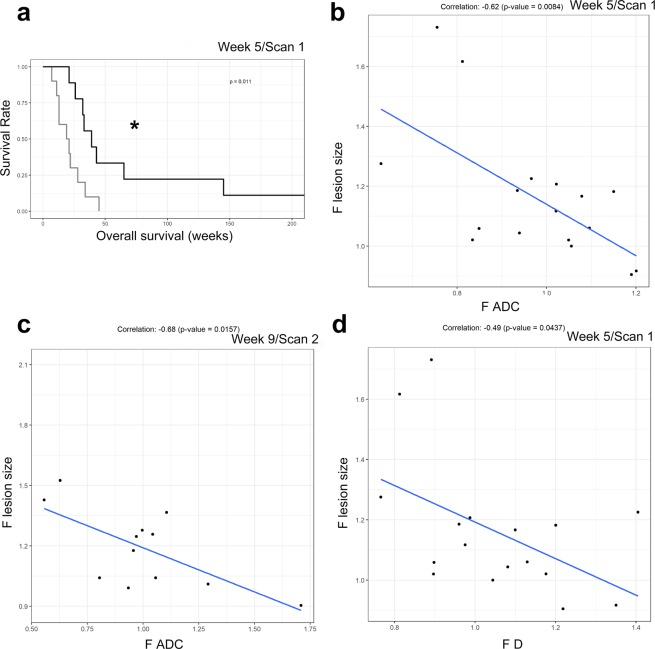
Figure 4.
(a) Patients with F D value above the median had a significantly better OS at week 5 (Scan 1), including all patients (n = 21, p = 0.011). The black line shows the F D value above the median, while the grey line shows F D value below the median.(b) Correlation for F ADC with the fold change of the lesion size based on RECIST 1.1 at week 5 (Scan 1). The gray line is the fitted regression line. The correlation coefficient was −0.62 and p = 0.008. (c) Correlation for F ADC with the fold change of the lesion size based on RECIST 1.1 at week 9 (Scan 2). The gray line is the fitted regression line. The correlation coefficient was −0.68 and p = 0.016. (d) Correlation for F D with the fold change of the lesion size based on RECIST 1.1 at week 5 (Scan 1). The gray line is the fitted regression line. The correlation coefficient was −0.49 and p = 0.044. (* indicates p < 0.05).

