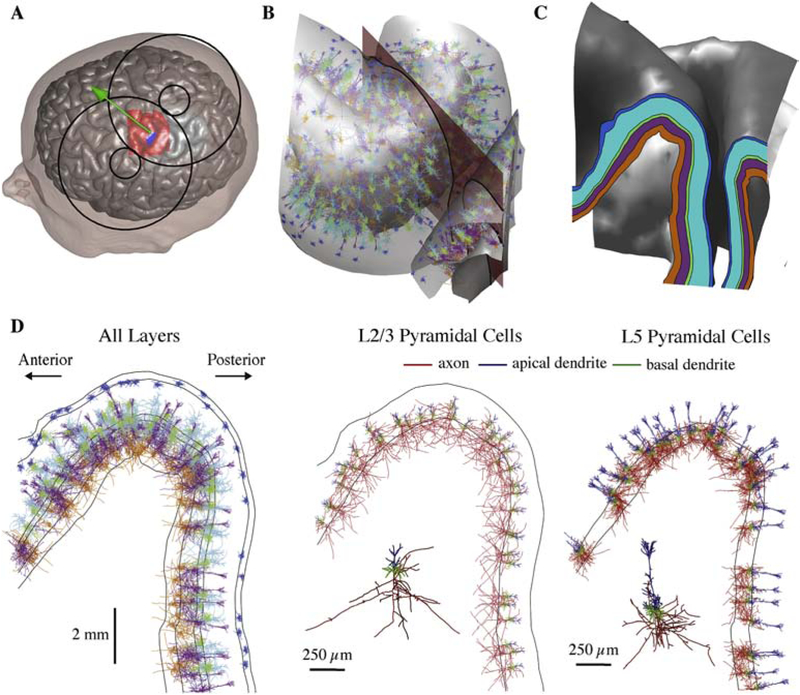
Figure 2. Embedding populations of cortical neuron models in FEM models of TMS induced E-fields.
A) Scalp and gray matter meshes are shown with the overlying TMS coil outline. The coil center and orientation are given by the green sphere and arrow, the hand knob region populated with neurons is indicated in red, and the putative hand muscle representation used in Figure 7 is shown in blue. B) Model neurons located in the crown of the pre-central gyrus between the gray matter and white matter surfaces. One clone from each layer is shown with color corresponding to layer (shown in C); five co-located model neuron populations (virtual clones of each cell type) are simulated in each layer. The 2D analysis plane (red) is used to visualize threshold data in Figure 5 and also shown in C–D. The plane is parallel to coil orientation (45° relative to midline). C) Cortical layers used to place and orient model neurons shown in 2D analysis plane, extracted by intersecting the analysis plane with the layer surfaces. D) Neural populations from B visualized within the 2D analysis plane. Neurons in all five layers are plotted with their respective layer colors (left). L2/3 (middle) and L5 (right) PC populations are plotted with axon, apical dendrites, and basal dendrites colored separately.

