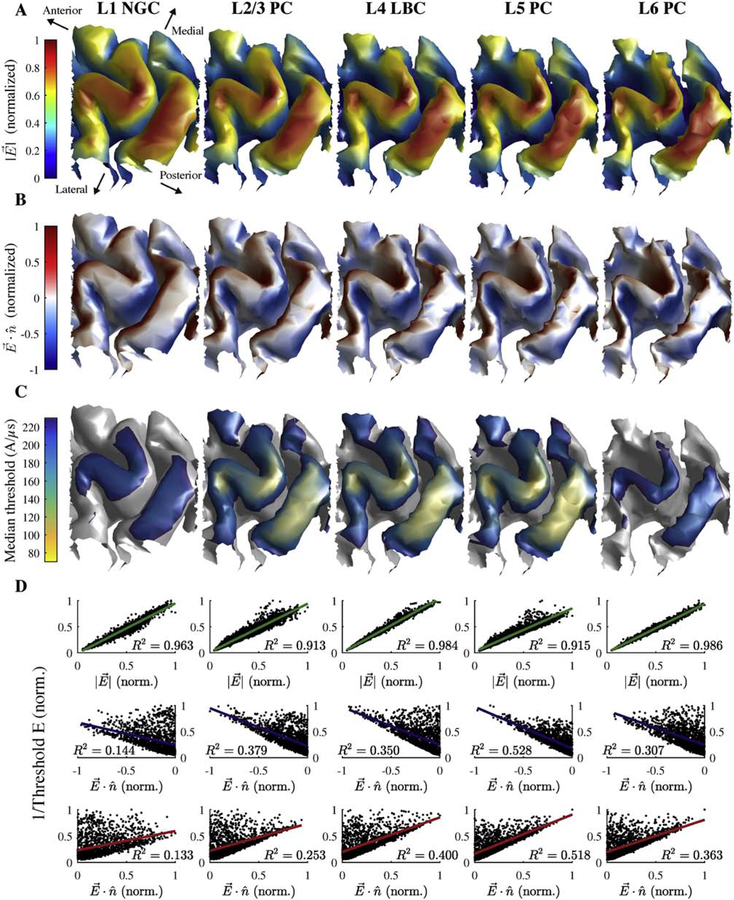
Figure 3. Layer-specific spatial distribution of activation thresholds correlate better with the E-field magnitude than normal component.
A) Magnitude of simulated E-field (normalized across layers) on layer surfaces for L1–L6 arranged adjacent to each other. B) Component of E-field normal to layer surfaces (normalized across layers). Positive values indicate E-field pointing out of surface and negative values indicate inward E-field. C) Median thresholds (across 5 clones and 6 rotations) for monophasic P–A simulation. D) Inverse threshold of each cell plotted against E-field magnitude (top) and absolute value of normal component (bottom) at soma, both normalized to maximum within layer (in A). Each plot includes R2 value for linear regression of inverse threshold with corresponding E-field metric.

