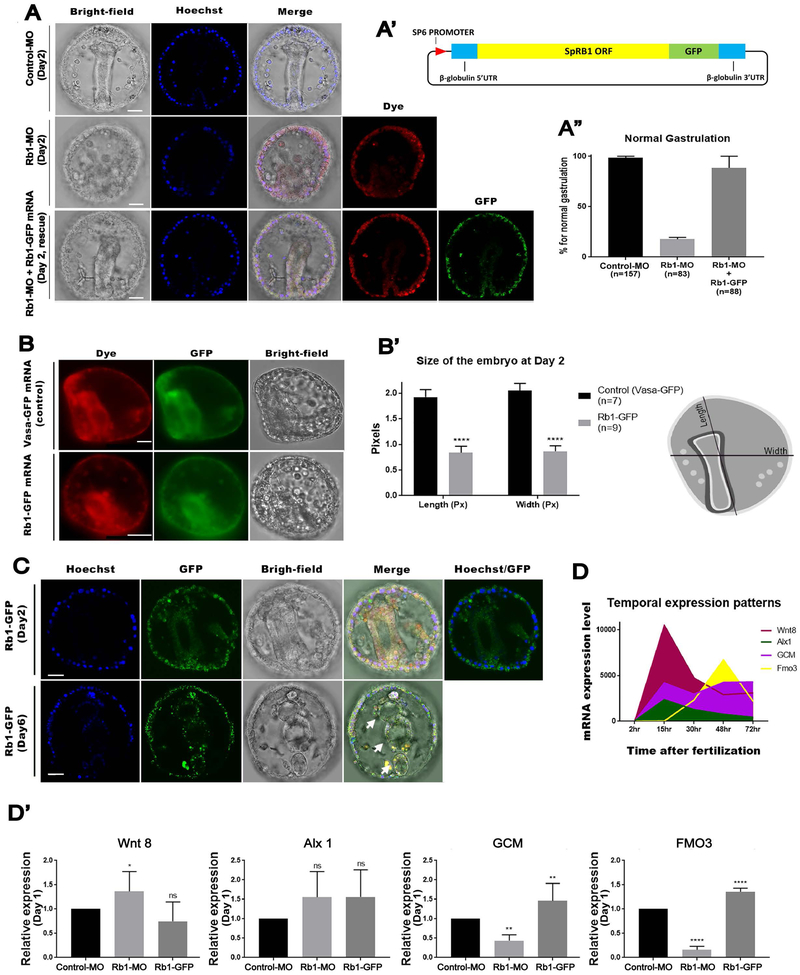
Fig.3. Rb1 knockdown compromised development while Rb1 overexpression prematurely progressed development of the embryo.
A – A”) Rb1-MO inhibited gastrulation, and this phenotype was rescued by co-introduction of Rb1-GFP mRNA at 98.2% as shown in the graph (A”). () indicates the total number of gastrulated embryos counted for each group at Day 2. DNA (blue), Rb1-GFP protein (green), Dye (red) and Bright-field. Images were taken by confocal laser microscopy. (A’) indicates a construct design of Rb1-GFP. Scale bars=20 μm. B & B’) Rb1-GFP overexpression induced the smaller-sized embryos compared to the controls (Vasa-GFP embryos) at Day 2. The embryo size (Length and Width in pixels) was measured by Image J (n=7 for Vasa-GFP and n=9 for Rb1-GFP) as shown in the drawing on the right (A’). Images were taken by fluorescent microscopy. Scale bars=20 μm. C) The Rb1-GFP embryos at Day 2 and Day 6. Upper arrow indicates the differentiated body structure of fore-gut, the arrow in the middle indicates the middle-gut and the last arrow marks the hind-gut. Hoechst (blue), Rb1-GFP (green), and Bright-field. Images were taken by confocal laser microscopy. Scale bars=20 μm. D) Temporal mRNA expression pattern of each gene of interest is shown in the graph. The data was extracted from echinobase.org. X-axis indicates hours post fertilization. Images were taken by confocal laser microscopy. Scale bars=20 μm. D’) RT-qPCR results of Wnt8, Alx1, Glial Cell Missing (GCM), or Flavin-containing monooxygenase 3 (Fmo3) expression in the control, Rb1-MO and Rb1-GFP OE embryos at Day 1 (23~26 hours post fertilization). Copy number of each gene expression was normalized by that of Ubiquitin, a housekeeping gene, to obtain the Relative expression value. The relative value was then divided by that of the control to obtain the final relative value. Each graph was a combination of the four independent experimental results. Data are presented as mean ± s.e.m. *P<0.05.

