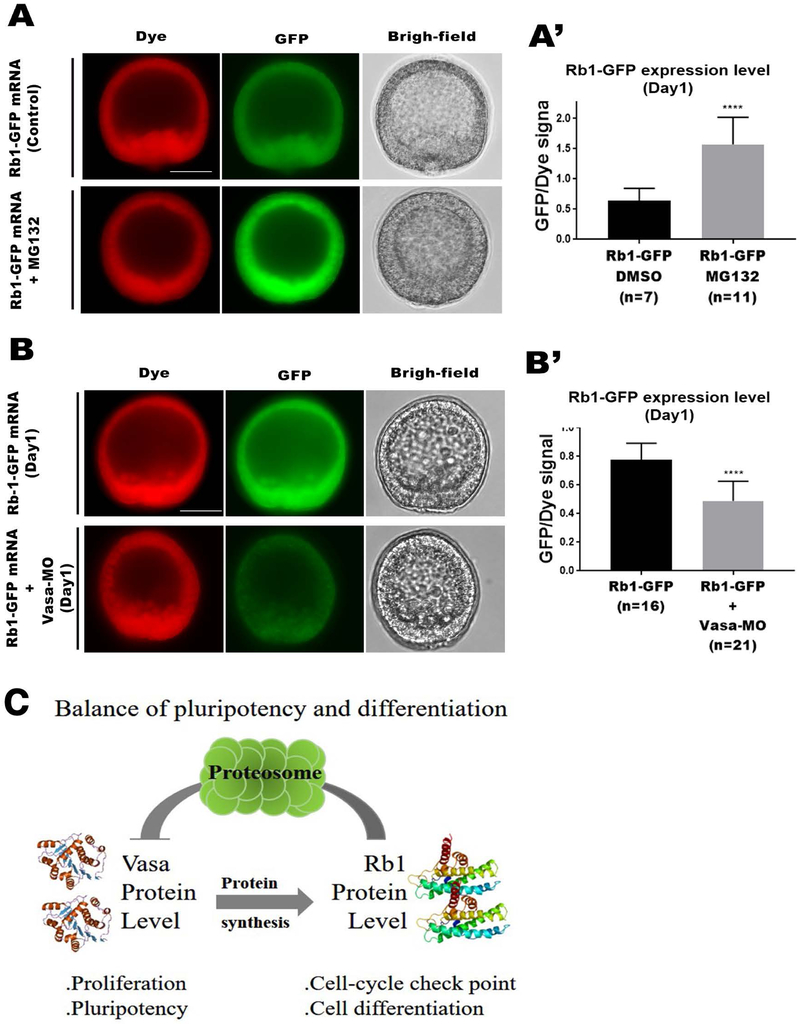
Fig.5. Vasa positively regulates Rb1 protein expression.
A-B’) Live imaging of Rb1-GFP embryos treated with DMSO (control; Upper panels) or with MG132 (Lower panels) at Day1 (A & A’). Live imaging of Rb1-GFP (control; Upper panels) or Rb1-GFP+Vasa-MO (Lower panels) embryos at Day 1 (B & B’). The graphs indicate the relative Rb1-GFP expression level in each embryo group (A’ & B’). The total level of Rb1-GFP was normalized by that of the dye to obtain the relative Rb1-GFP expression level using Image J. () indicates the total number of embryos analyzed for each group at Day 1. Dye (red), Rb1-GFP (green), and Bright-field. Images were taken by fluorescent microscopy. Scale bars= 20 μm. Scale bars= 20 μm. C) A hypothetical model for Rb1 function in embryonic development. Rb1 facilitates cell differentiation by negatively regulating Vasa protein while Vasa positively regulates Rb1 protein, maintaining a fine balance of cell proliferation and differentiation in the somatic lineages during embryogenesis.

