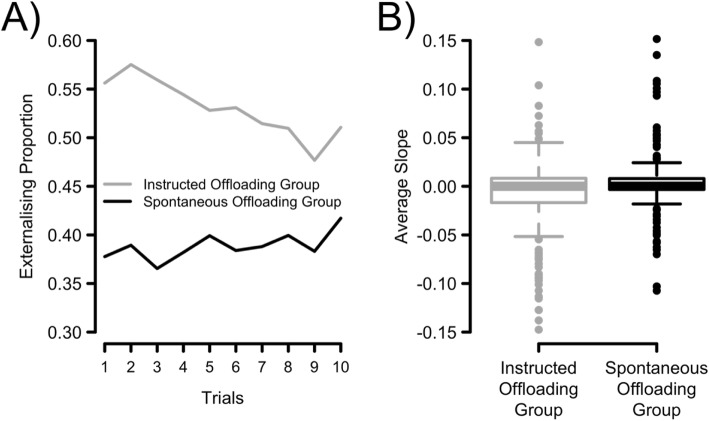
Fig. 4.
a Externalising proportion (proportion of non-target trials moved minus proportion of target trials moved) across trials. b Group-wise distributions of individual slopes from a regression model in which trial predicts the externalising proportion. The boxplots reflect the interquartile range (IQR) together with the median. The whiskers span from the first quartile minus 1.5 times the IQR to the third quartile plus 1.5 times the IQR. Data points outside this inner fence are defined as outliers and are shown as individual data points

