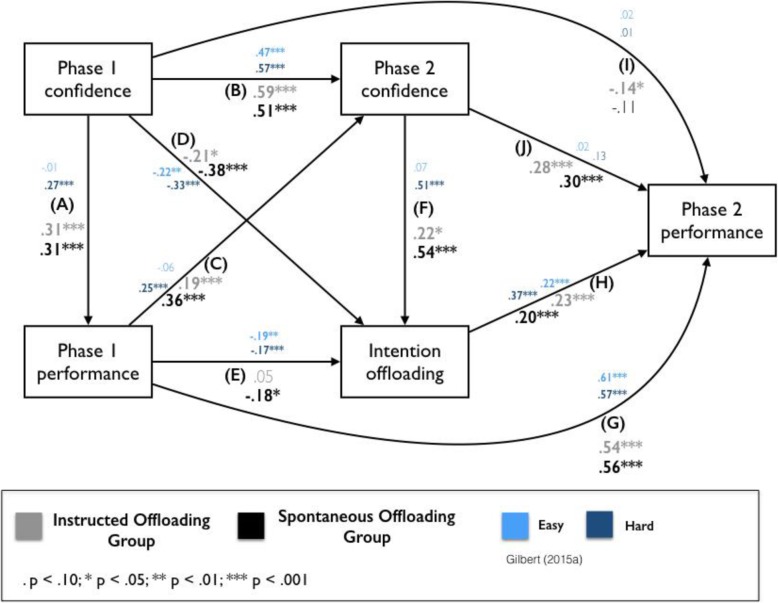
Fig. 5.
Path analysis model of the relationships between different measures recorded during the study. Standardised beta weights for the Instructed Offloading Group are shown in grey. Weights for the Spontaneous Offloading Group are shown in black. Results for Gilbert (2015b) are shown in blue. Boldface indicates a reliable path weight

