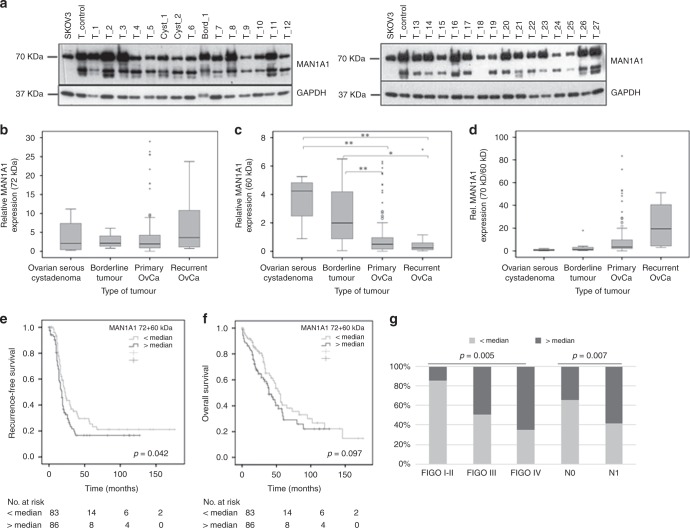
Fig. 1.
MAN1A1 protein expression in ovarian tumours and its impact on patient survival. a Representative western blot results of MAN1A1 expression in ovarian carcinomas (T_), borderline tumours (Bord_) and benign cystadenomas (Cyst_). Protein extract from the ovarian cancer cell line SKOV3 as well as protein extract from a selected tumour tissue sample (T-control) were included in each gel as internal controls. As loading control, GAPDH expression is shown. b, c Box plots showing MAN1A1 expression relative to the control cell line in different ovarian tumour types (b 72 kDa-band; c ca. 60 kDa-bands). d Box plots showing the ratio of the two measured MAN1A1 forms (70 kDa/ca. 60 kDa) in different tumour types. Significant differences after t-tests are marked by asterisks (*p < 0.05; **p < 0.01). Whiskers represent the minimum and maximum rating values, circles represent outliers and asterisks represent extreme outliers of each box plots. e, f Kaplan-Meier analysis and Log-rank test showing a significant correlation of high MAN1A1 (72 kDa + 60 kDa) protein expression (>median) with shorter recurrence-free survival and a trend towards overall survival. g Correlation analysis by Chi-square-test showing a significant association of high MAN1A1 (72 kDa + 60 kDa) protein expression (>median) with higher FIGO stages and nodal involvement

