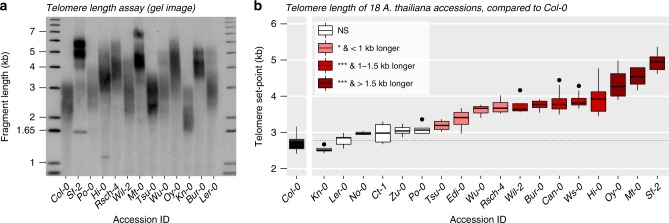
Fig. 1.
Parental genotypes of the Arabidopsis MAGIC population display different telomere length set points. a A representative TRF southern blot of genomic DNA from Arabidopsis accessions (genotypes). b Between 4 and 17 individual plants were analyzed for each accession. The mean telomere length distribution of each genotype is shown in boxplots, where the ‘boxes’ represent the interquartile range (IQR), the whiskers extend to the largest and smallest observations within 1.5 * IQR and points represent observations outside of the 1.5 * IQR. The boxes are colored by the significance of a Tukey’s HSD test between each parent and the reference genotype, Col-0. Significance codes: NS: P > 0.05, *P ≥ 0.005, ***P < 0.005.

