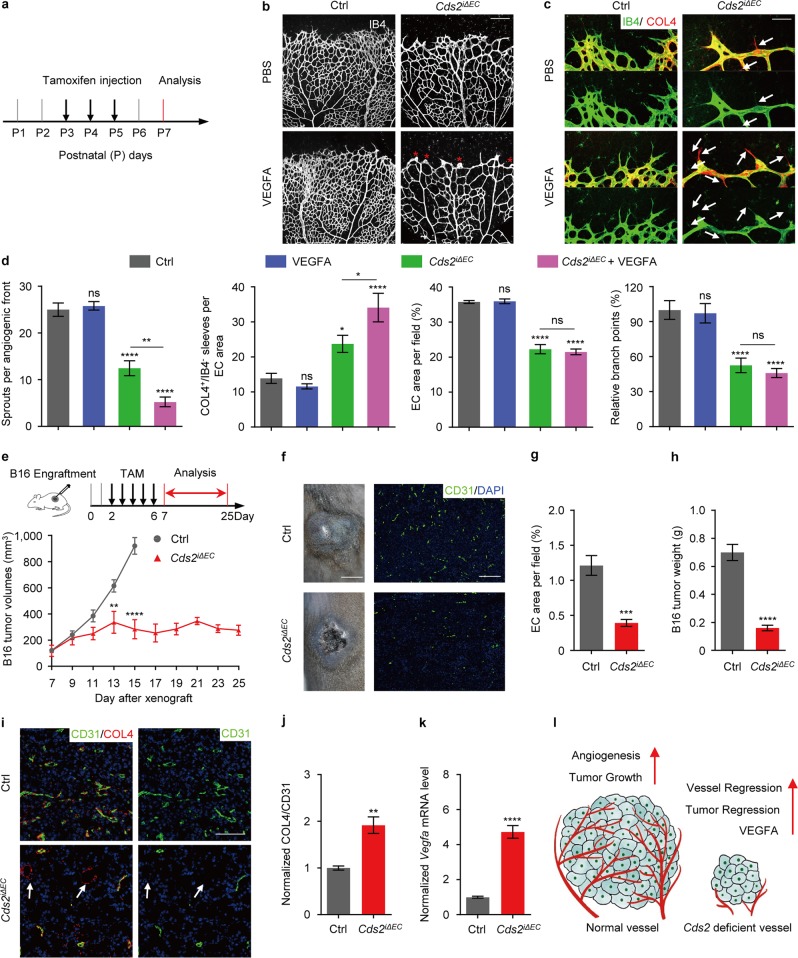
Fig. 2.
Vessel regression in CDS2 endothelium-specific knockout mice. a Model of tamoxifen treatment on mouse pups. Confocal images of isolectin B4 (IB4) (b) and IB4/Collagen IV (COL4) (c) double stained retinal vessels at postnatal day (P) 7 in Cds2iΔEC or control mice with or w/o VEGFA injection. Asterisks display the blunt angiogenic front. Arrows indicate COL4+/IB4− empty sleeves. d Bar graphs showing analysis of angiogenic sprouts, COL4+/IB4− empty sleeves, endothelial area and vascular branch points. n = 6–10 mice per group. Inactivation of Cds2 caused retardation of B16 tumor growth (e), necrosis (f; left panels, day11 tumors), blood vessel (f; right panels and g) and tumor weight (h) reduction. Schematic diagram (e) shows the strategy to inactivate Cds2 after tumor cell implantation. n = 6–8 tumors from 6–8 mice per group. Anti-COL4 and anti-CD31 co-immunostaining (i) and quantitative analysis (j) on B16 tumors from control or Cds2iΔEC mice at 13 days post-implantation. Arrows indicate regressed vessels. n = 6 tumors from 6 mice as a group. k Quantification of Vegfa mRNA level in day 9 B16 tumors. n = 8 tumors from 4 mice per group. l Model of VEGFA dose-dependent tumor vessel regression in CDS2-deficient endothelium. Left panel shows that increased angiogenesis associates with increased tumor growth in WT mice. Right panel depicts that vessel regression occurs in CDS2-deficient vessels, associated with high level of VEGFA produced by tumor, which in turn further advances vessel regression and blocks tumor progression. Scale bars, 200 μm (b and f; right panel), 70 μm (c), 0.5 cm (f; left panel) and 100 μm (i). Error bars, mean ± SEM. Statistical significance between the indicated sample versus control or between the marked pairs are *P < 0.05, **P < 0.01, ***P < 0.001, ****P < 0.0001, or ns, not significant (P ≥ 0.05). See also Supplementary information, Figs. S2–S5

